The week's signal is a softer-than-feared inflation print landing against a hawkish-hold Fed. April core PCE printed 3.3% YoY with the MoM at 0.2% versus the 0.3% consensus, and the 10Y fell to 4.48% (-4.1% WoW) while the 2Y held at 4.00%.
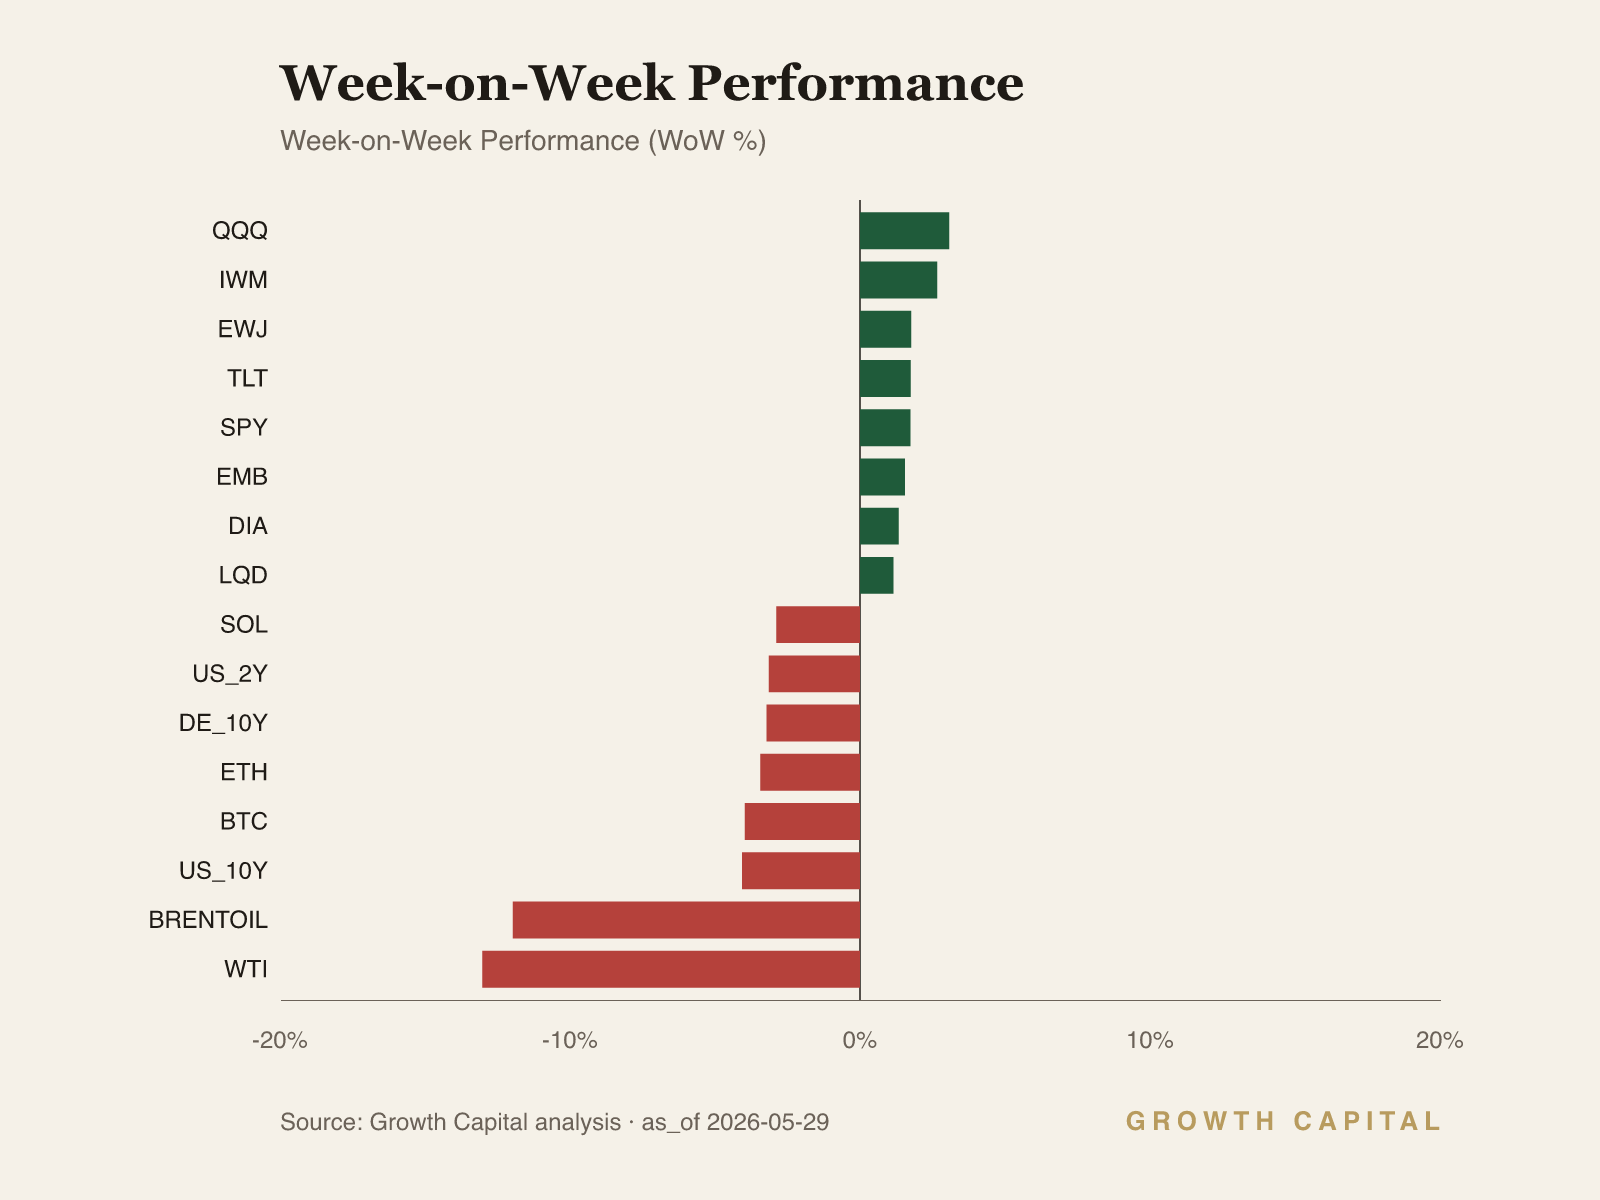
Equity beta is extended, not broken. QQQ closed at 736.49 (+3.1% WoW, +20.1% YTD) at the top of its 52-week range, and SPY at 755.68 is now at its own 52-week high after a multi-week advance.
Crude's sharp reversal is the cleaner risk-sentiment tell. Brent fell to $102.75 (-12.0% WoW) and gold barely moved at 418.20 GLD (+0.3% WoW), a divergence that says the energy-inflation premium is being unwound faster than the safe-haven bid.
Our positioning: A cooling 3.3% core PCE resolves into a flatter curve, not a cutting cycle; stay neutral duration and quality-tilt equity beta.
A cooling inflation print resolves into a flatter curve, not a cutting cycle
We read this week as a hawkish hold with a disinflation tilt, not the opening of a cutting cycle. April core PCE came in at 3.3% YoY with the MoM at 0.2%, one tick under the 0.3% consensus, while headline PCE held at 3.8% YoY. The 10Y Treasury yield fell to 4.48% (-4.1% WoW) and the 2Y to 4.00% (-3.1% WoW), leaving a 10Y-2Y spread of 48bp from the snapshot legs. Fed officials this month signalled no urgency to cut with policy described as well positioned, and the funds rate sits at 3.64% per the latest reading. The single house-view thesis: the market is pricing the last mile of disinflation as slow and expensive, and the curve is flattening to reflect that, not steepening into easing. Risk assets are leaning on the soft MoM print while the policy reaction function stays defensive against an energy-driven upside surprise. We position for a flatter curve and a defended front end rather than a rally in duration.
The primary chain runs through the front end. The 2Y at 4.00% has fallen -3.1% WoW yet remains well above its 52-week low of 3.38% and only 13bp under the 4.13% high, so the near-term path still prices a Fed that holds. The transmission is direct: a 0.2% core MoM lowers the immediate pressure for a hike, which caps the 2Y, but the absence of a credible cut signal and a 3.64% funds rate floor prevents the 2Y from following the 10Y lower. The 10Y, more sensitive to the growth-and-term-premium channel, fell 4.1% on the softer print and on crude's reversal easing the headline-inflation impulse, compressing the 10Y-2Y gap toward 48bp. That flattening is the bond market saying the policy rate stays high for longer while distant growth and inflation expectations cool. We are neutral duration via TLT at 85.69 (+1.7% WoW) and prefer the belly to the long end on a three-to-six-month horizon, accepting lower carry for lower convexity risk if the energy shock re-accelerates. We would flip to overweight duration if the 10Y broke above its 4.67% 52-week high on a supply or fiscal shock, which would signal term premium, not growth, is setting the long end and that the flattening thesis has failed.
The cross-asset tape both confirms and complicates the read. SPY at 755.68 sits at its 52-week high (+1.7% WoW, +10.6% YTD) and QQQ at 736.49 is overbought at the top of its range (+3.1% WoW, +20.1% YTD), which confirms the soft-landing interpretation of a cooling core print. The mechanism is the rates-to-multiples channel: a lower 10Y at 4.48% reduces the discount rate on long-duration tech cash flows, and the QQQ leadership over the +5.4% YTD DIA is exactly the duration-sensitive rotation that a falling 10Y produces. The contradiction sits in commodities and credit. HYG at 80.32 is barely positive (+0.5% WoW) and EMB at 96.47 (+1.6% WoW) is the stronger credit leg, while crude's -12.0% WoW collapse removes a key inflation driver that had underwritten the energy and materials trade. We resolve the tension in favour of the equity tape: with core PCE at 3.3% and the 10Y falling, the disinflation read dominates the growth-scare read, and the 48bp curve is too positive to signal recession. We stay neutral US large-cap beta and overweight quality over the most overbought growth, and we would cut equity beta if HYG broke below its 78.72 52-week low, which would say credit is pricing a default cycle the equity index is ignoring.
The second material rail is the dollar and the energy complex together. DXY at 119.29 is flat WoW and -2.7% YTD, EUR/USD at 1.1603 is slightly oversold (-0.2% WoW), and USD/JPY at 159.20 sits just under its 160.23 high as a cooling Tokyo CPI keeps the BoJ on hold and widens the rate gap. The coherence check ties back to the hawkish-hold thesis: a flat dollar alongside falling crude and a cooling core print is a clean risk-on signal, not a flight to safety, which is why gold at 418.20 GLD moved only +0.3% WoW. A genuine growth scare would have bid the dollar and gold together; instead both are quiet while equities make highs. We are neutral the dollar and would revisit only on a decisive USD/JPY break of 160.23.
What would change our view runs in two directions with named levels. The downside falsifier: a 10Y close above 4.67% or an HYG print below 78.72 would tell us the curve is steepening on term premium or that credit is cracking, and we would move underweight equity beta and long-end duration together. The upside falsifier: a second sub-0.2% core PCE MoM print plus a 2Y break below 3.38% would confirm the easing cycle is real, at which point we add duration and small-cap beta via IWM (290.02, +2.7% WoW). The standing risk is energy: crude has fallen -12.0% WoW on ceasefire hopes, and a reversal that pushes the headline-inflation impulse back up is the most direct threat to both the disinflation read and the flattening trade. Source: GrowthCapital analysis; data via FRED, BEA, Bloomberg snapshot as of 29 May 2026.
Fixed Income
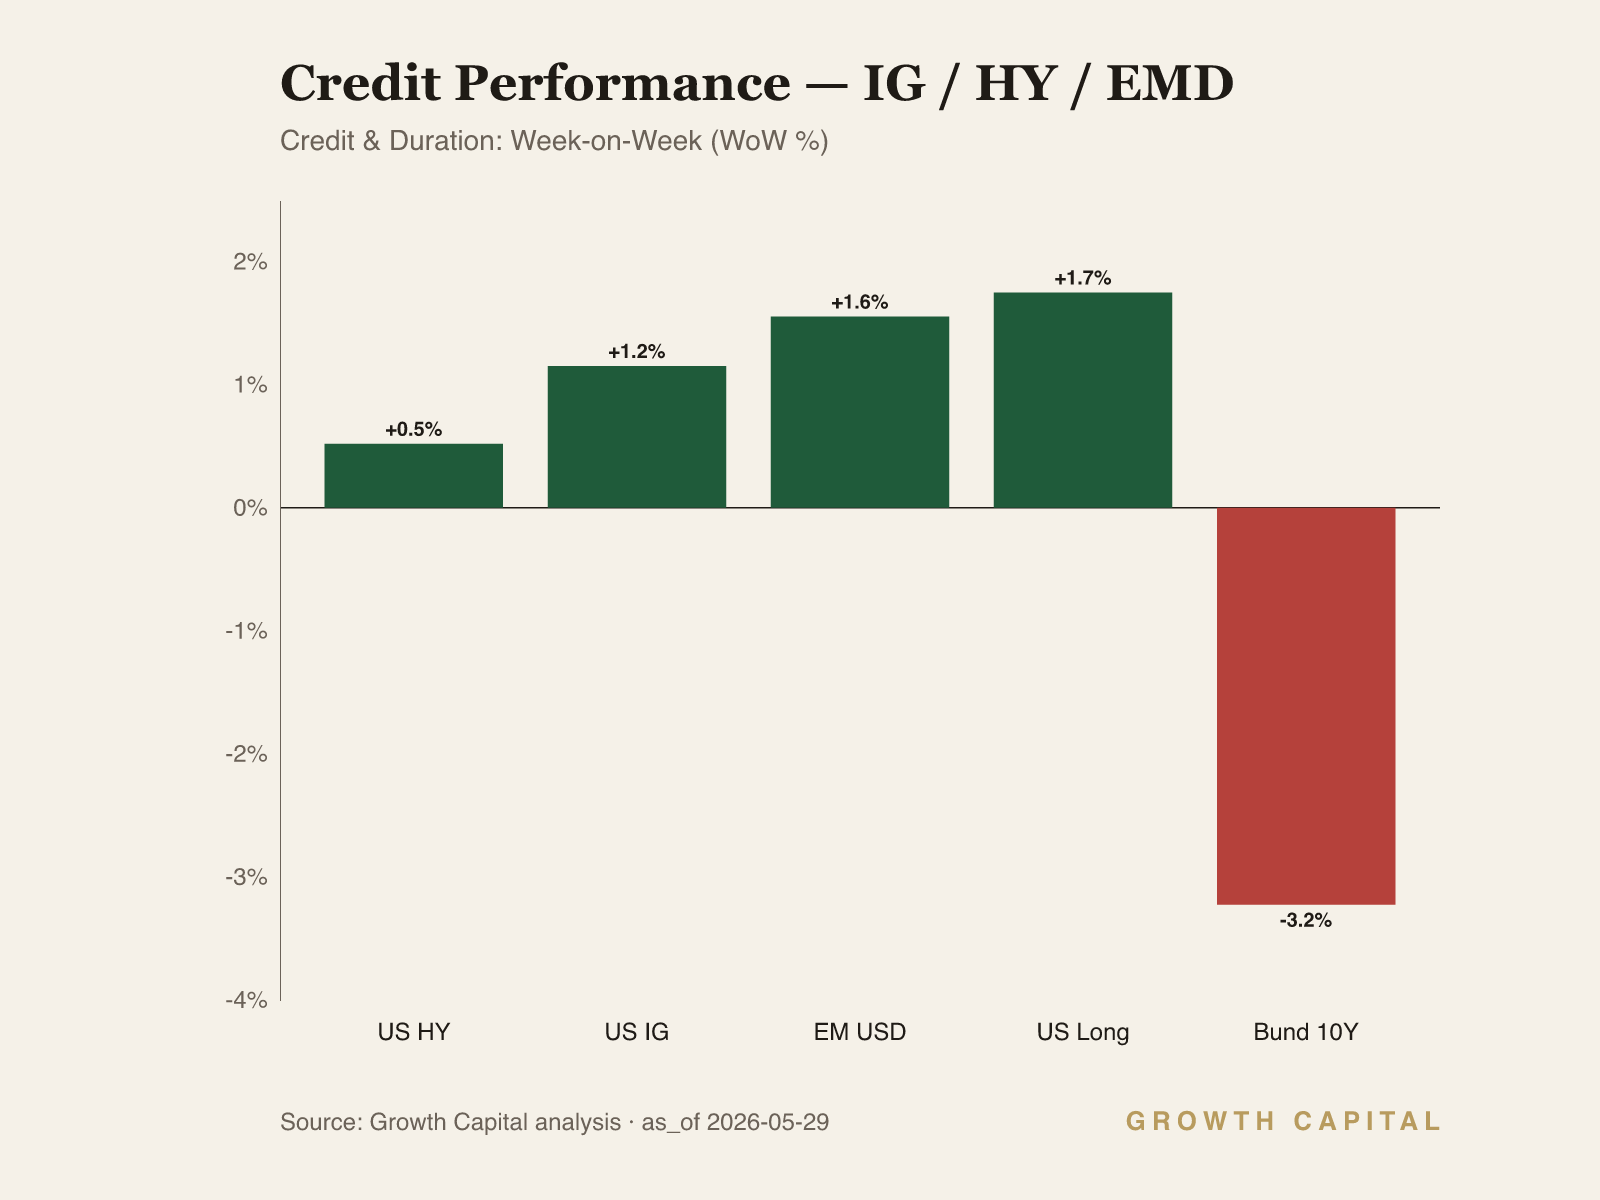
The week's rates move was a flattening on a soft core PCE print, not a duration rally. The 10Y fell to 4.48% (-4.1% WoW) and the 2Y to 4.00% (-3.1% WoW), leaving a 10Y-2Y gap of 48bp from those two legs, with both yields still inside their 52-week ranges (10Y low 3.97%, high 4.67%; 2Y low 3.38%, high 4.13%). The transmission is the policy-reaction channel. A 0.2% core MoM removes the case for a near-term hike, which anchors the 2Y, but a 3.64% funds rate and explicit no-urgency-to-cut guidance keep the front end from following the long end down. The 10Y carries the growth-and-term-premium load, so the softer print plus crude's reversal pulled it 4.1% lower while the 2Y barely moved, compressing the curve. We are neutral duration: TLT at 85.69 (+1.7% WoW, -1.5% YTD) has rallied but remains capped by the high-for-longer front end, and we prefer the belly for its lower convexity risk on a three-to-six-month view. IG via LQD at 109.42 (+1.2% WoW) and EM sovereigns via EMB at 96.47 (+1.6% WoW) outperformed high yield, a quality lean we share. We would shift overweight duration only on a 10Y break above 4.67%, which would reprice the long end on supply and term premium rather than growth.
Equities
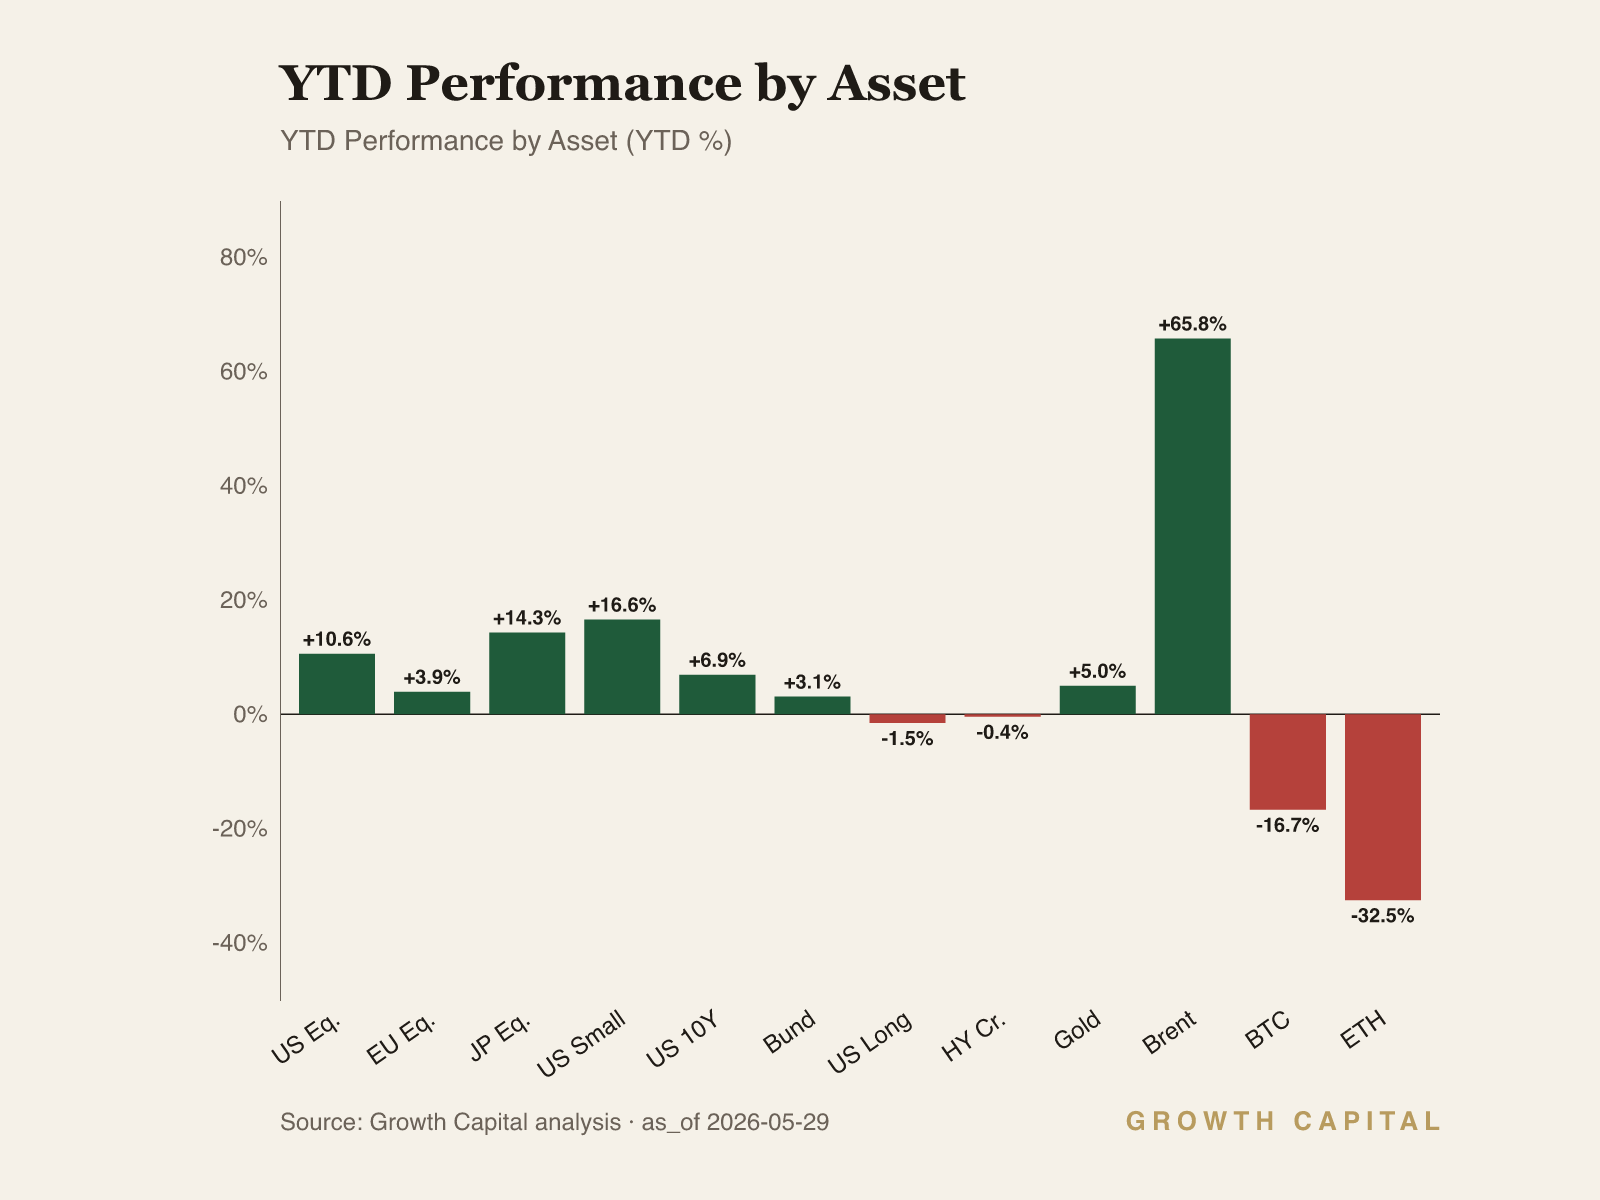
US large-cap beta is extended and confirming the soft-landing read, but the leadership is narrow. SPY closed at 755.68, its 52-week high (+1.7% WoW, +10.6% YTD), and QQQ at 736.49 is overbought at the top of its range (+3.1% WoW, +20.1% YTD), while DIA at 509.83 (+1.3% WoW, +5.4% YTD) lags by a wide YTD margin. The mechanism is the rates-to-multiples channel. The 10Y falling to 4.48% lowers the discount rate on long-duration cash flows, and the QQQ's 20.1% YTD against DIA's 5.4% is the duration-sensitive rotation that a lower long yield produces. Small caps confirm risk appetite: IWM at 290.02 (+2.7% WoW, +16.6% YTD) sits just under its 292.03 high. The crash condition is crowding. QQQ at the top of its 52-week range and overbought is a momentum-and-low-vol trade that unwinds violently if the 10Y reverses higher. We are neutral US large-cap beta and overweight quality over the most overbought growth, accepting we give up upside if the melt-up extends, in exchange for less drawdown if the rate move inverts. Europe via FEZ at 67.95 (+0.7% WoW, +3.9% YTD) and Japan via EWJ at 92.99 (+1.8% WoW, +14.3% YTD) lag the US tape and offer cheaper beta. We would cut equity beta on a 10Y break above 4.67% or an HYG break below 78.72.
Commodities
Gold is the cleanest commodity read this week because the crude tape carries a source divergence we will not lean on. GLD closed at 418.20 (+0.3% WoW, +5.0% YTD), nearly flat against an equity index making new highs and a 10Y falling to 4.48%. The mechanism is the real-rate and safe-haven channel. With core PCE cooling to 3.3% and the dollar flat at 119.29 DXY, the inflation-hedge bid that drives gold has no fresh catalyst, and the muted +0.3% WoW move tells us the metal is consolidating rather than confirming a growth scare. Had this week been a genuine risk-off event, gold and the dollar would both have rallied; instead both are quiet while equities advance, which corroborates the hawkish-hold-with-disinflation read rather than a flight to safety. Gold sits well below its 495.90 52-week high after a 5.0% YTD gain, so the trend is intact but stalled. We are neutral gold as a strategic hedge: the +5.0% YTD return is real diversification against the fiscal-dominance backdrop, but the absence of a near-term real-rate catalyst caps the tactical case. We would move overweight on a decisive 10Y break below its 3.97% 52-week low, which would restart the negative-real-rate engine that drives bullion. The standing energy risk is a crude reversal feeding the headline-inflation impulse back into the complex.
Forex
The dollar's calm is itself the signal. DXY at 119.29 is flat WoW and -2.7% YTD, sitting mid-range between its 117.44 low and 122.04 high, while EUR/USD at 1.1603 is slightly oversold (-0.2% WoW, -1.2% YTD) and GBP/USD at 1.3439 firmed (+0.8% WoW). The mechanism is the rate-differential and carry channel. USD/JPY at 159.20 (+0.3% WoW) sits just under its 160.23 52-week high because a cooling Tokyo CPI keeps the BoJ on hold while the Fed holds at 3.64%, sustaining the wide nominal gap that funds the yen carry trade. A flat dollar alongside falling crude and a softer core print is a coherent risk-on signal, not the safe-haven dollar bid a growth scare would produce, which lines up with the equity highs and the muted gold tape. The crash condition for the carry trade is a BoJ surprise or a sharp US front-end repricing. We are neutral the dollar: the -2.7% YTD drift is consistent with a market pricing eventual easing, but the flat WoW reading gives no tactical edge. EUR/USD oversold at 1.1603 against a -1.2% YTD move offers a modest mean-reversion lean. We would revisit the dollar view decisively on a USD/JPY break of 160.23, which would force the question of BoJ intervention and a carry unwind.
GC Views
| Asset | View | Rationale |
|---|---|---|
| US_10Y | N | 10Y at 4.48% (-4.1% WoW); neutral duration, prefer belly; OW only on a break above 4.67%. |
| SPY | N | At 755.68 52-week high (+10.6% YTD); neutral beta, OW quality over overbought growth. |
| GLD | N | 418.20 (+5.0% YTD); strategic hedge intact, no near-term real-rate catalyst to add. |
| BTC | UW | 73,955 (-16.7% YTD); all major perps cohorts net short, whales -$74M; no flow support. |
| EURUSD | N | 1.1603 slightly oversold (-1.2% YTD); modest mean-reversion lean, no tactical edge. |
| US_2Y | N | 4.00% (-3.1% WoW); anchored by 3.64% funds rate and no-urgency-to-cut guidance. |
| TLT | N | 85.69 (+1.7% WoW); capped by high-for-longer front end, prefer belly. |
| QQQ | N | 736.49 overbought at range top (+20.1% YTD); momentum crowding, neutral not chasing. |
| DIA | N | 509.83 (+5.4% YTD) lags QQQ; value rotation not yet confirmed. |
| IWM | N | 290.02 (+16.6% YTD) near high; add beta only on confirmed easing and 2Y break below 3.38%. |
| USDJPY | N | 159.20 near 160.23 high; carry intact on wide rate gap, watch BoJ break. |
| GBPUSD | N | 1.3439 (+0.8% WoW); sterling firm, no directional conviction. |
On-Chain Pulse
The aggregate on-chain pattern across the majors is defensive: every large derivatives cohort is net short Bitcoin on Hyperliquid even as spot coins leave exchanges, a split between cautious perps positioning and quiet spot accumulation. The cohort lean is short-dominant on BTC, and the week's price action (BTC -4.0% WoW, ETH -3.4% WoW, SOL -2.9% WoW) confirms the derivatives caution rather than spot conviction. We read this as positioning for a continued grind, not capitulation.
Bitcoin's on-chain and derivatives data split cleanly. Spot flows are mildly constructive: exchange wallets saw a net outflow of $19.1M (2.0x above average), coins leaving exchanges, while whale wallets logged a small net inflow of $279k (0.4x below average across 13 wallets) and top PnL traders took $10.2M of profit off the table. Derivatives tell the opposite story. On Hyperliquid perps every major cohort is net short: smart traders net short $31.9M (longs $24.1M against shorts $56M on $80.1M total), and whales net short $74M (longs $775.6M against shorts $849.6M on $1.6B total), a far larger short book than the smart-trader cohort runs. Named institutional positions are mixed, with Galaxy Digital holding a $9.2M long at 20x leverage underwater at a $76,558 entry against BTC spot of 73,955. The spot-leaving-exchanges signal is constructive, but a $74M whale short on $1.6B of exposure is the dominant tell. We are underweight BTC (73,955, -16.7% YTD) until the perps cohorts cover or spot inflows accelerate enough to absorb the short book.
Ethereum carries less granular derivatives detail in this week's intel than Bitcoin, but the directional read aligns with the BTC short bias. ETH fell to 2,026.56 (-3.4% WoW) and is the weakest major on a YTD basis at -32.5%, sitting near its 1,824.69 52-week low against a 4,685.41 high. The on-chain proxy flows that drove the BTC exchange-outflow signal do not extend to a comparable ETH whale-accumulation print in the intel block, so we treat the ETH move as beta to the BTC complex rather than an independent signal. With the perps cohorts short the lead asset and ETH trailing it lower, the funding and positioning backdrop offers no reason to step in front of the move. We are underweight ETH (2,026.56, -32.5% YTD) and would want either a decisive reclaim of the March highs or a clear shift in the BTC perps cohort before adding.
Solana's signal is institutional absence rather than active positioning. SOL fell to 82.74 (-2.9% WoW) and is down -34.8% YTD, the worst major performer, sitting just above its 77.86 52-week low against a 239.56 high. The intel notes SOL ETFs show no trading activity, a stark contrast to the live BTC and ETH ETF complexes, which tells us institutional demand for SOL exposure through the regulated wrapper is effectively nil. That absence of an ETF flow channel removes the marginal-buyer mechanism that has supported BTC, and it leaves SOL more exposed to the short-dominant perps backdrop across the complex. The spot-versus-flow read is unambiguous: no ETF bid, no whale accumulation print in the intel, and a price pinned near its 52-week low. We are underweight SOL (82.74, -34.8% YTD) until an ETF flow channel opens or the broader crypto perps lean turns net long.
XRP shows the one relative-strength flow in the complex. XRP fell to 1.3246 (-1.8% WoW), the smallest weekly drawdown among the majors, and is down -29.5% YTD. The intel flags XRP ETFs attracting $1.6M of inflows in the same window that Bitcoin ETFs saw $333M of outflows, a small absolute number but a meaningful relative divergence: capital rotated toward XRP exposure while it left the BTC wrapper. That marginal inflow, combined with the shallowest WoW decline, marks XRP as the relative outperformer within a falling complex. The absence of a whale-short print comparable to BTC's $74M leaves XRP less encumbered by the dominant short positioning. We are neutral XRP (1.3246, -29.5% YTD) on the relative-strength flow, an upgrade from the underweight we hold on the rest of the complex, though the YTD drawdown keeps us from an outright overweight.
Frontier Watch
The frontier signal this week sits in AI infrastructure financing and the largest pre-IPO filing on record. SpaceX filed what is described as the largest IPO in history, a frontier capital-markets event that will reset the benchmark for late-stage private valuations and pull allocator attention toward the pre-IPO venture tape. Separately, an Anthropic funding round is reported to value the AI firm near a trillion-dollar mark, which extends the late-cycle dynamic we are most cautious on: the financing of multi-year AI data-centre build-outs increasingly through off-balance-sheet vehicles partnered with private credit. The BIS Quarterly Review has flagged this as shadow borrowing, obligations economically akin to debt that sit outside corporate balance sheets and link hyperscalers to non-bank credit through funding lines that can transmit shocks via refinancing pressure. The equity-market expression of this is the QQQ leadership we flag in the equities section, where the 200G optical and compute build-out feeds Nvidia's continued earnings beats and the broader semis complex. For allocators the implication is twofold. The pre-IPO frontier offers genuine growth exposure, but the private-credit funding structure behind the AI capex cycle is the channel through which a late-cycle reversal would transmit, and it is not priced in the public equity multiple. We treat the frontier-AI complex as a momentum trade with a credit-cycle tail, not a clean secular long, and we size it accordingly. The named risk is a refinancing or private-credit-appetite shift that would expose the off-balance-sheet leverage funding the build-out.
What We're Watching
Two named falsifiers frame the week. Downside: a 10Y close above its 4.67% 52-week high or an HYG break below 78.72 tells us the long end is repricing on term premium or credit is cracking, and we move underweight equity beta and long-end duration together. Upside: a second sub-0.2% core PCE MoM print plus a 2Y break below 3.38% confirms the easing cycle, at which point we add duration and small-cap beta via IWM (290.02). The standing risk is energy: crude fell -12.0% WoW on ceasefire hopes, and a reversal that pushes the headline-inflation impulse back up is the most direct threat to both the disinflation read and the flattening trade.
This Week in Charts