The week's regime is a hawkish hold with a re-steepening curve. The 10Y at 4.49% (+22bp WoW) and the 2Y at 4.08% (+2bp WoW) leave a 41bp gap, with the published 10Y-2Y spread at 0.42, as the front end stays pinned by a 3.63% policy rate.
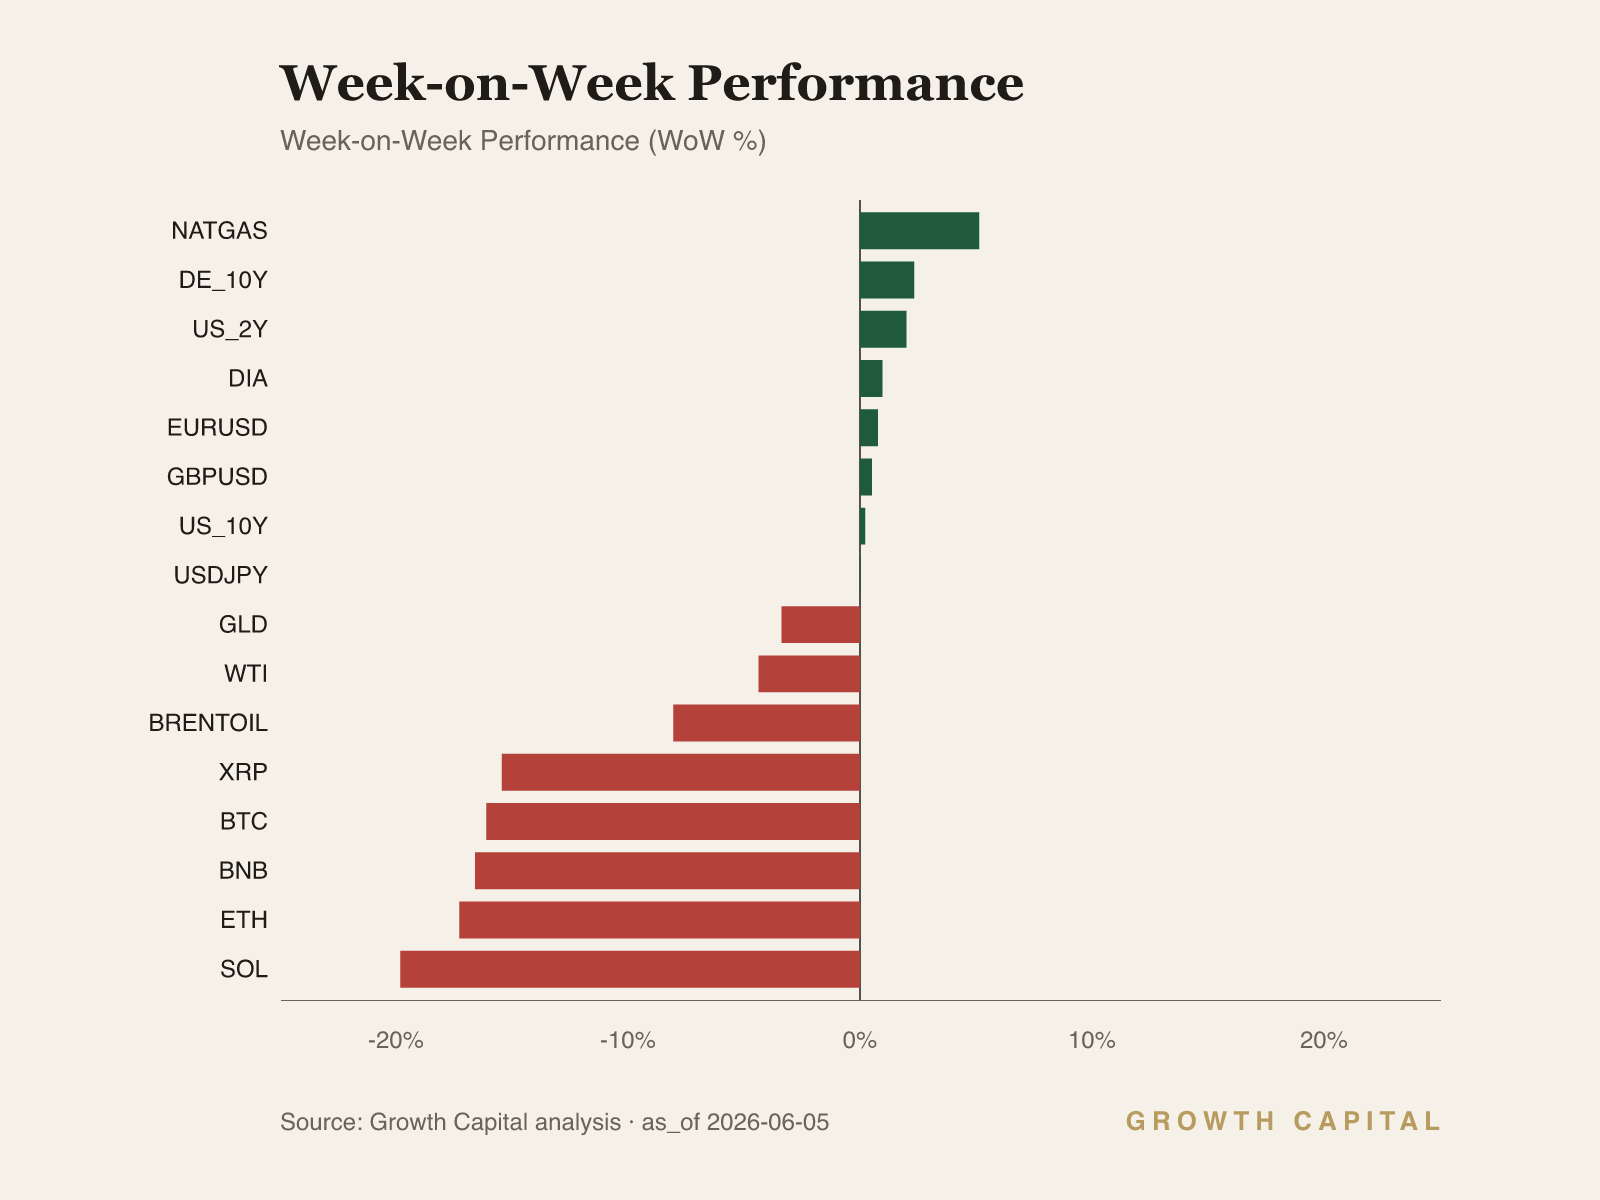
Energy unwound a geopolitical premium even as YTD gains stayed large. Brent fell -8.1% WoW and WTI -4.4% WoW, with both still up sharply YTD, on a fading Strait-of-Hormuz risk bid rather than fresh demand.
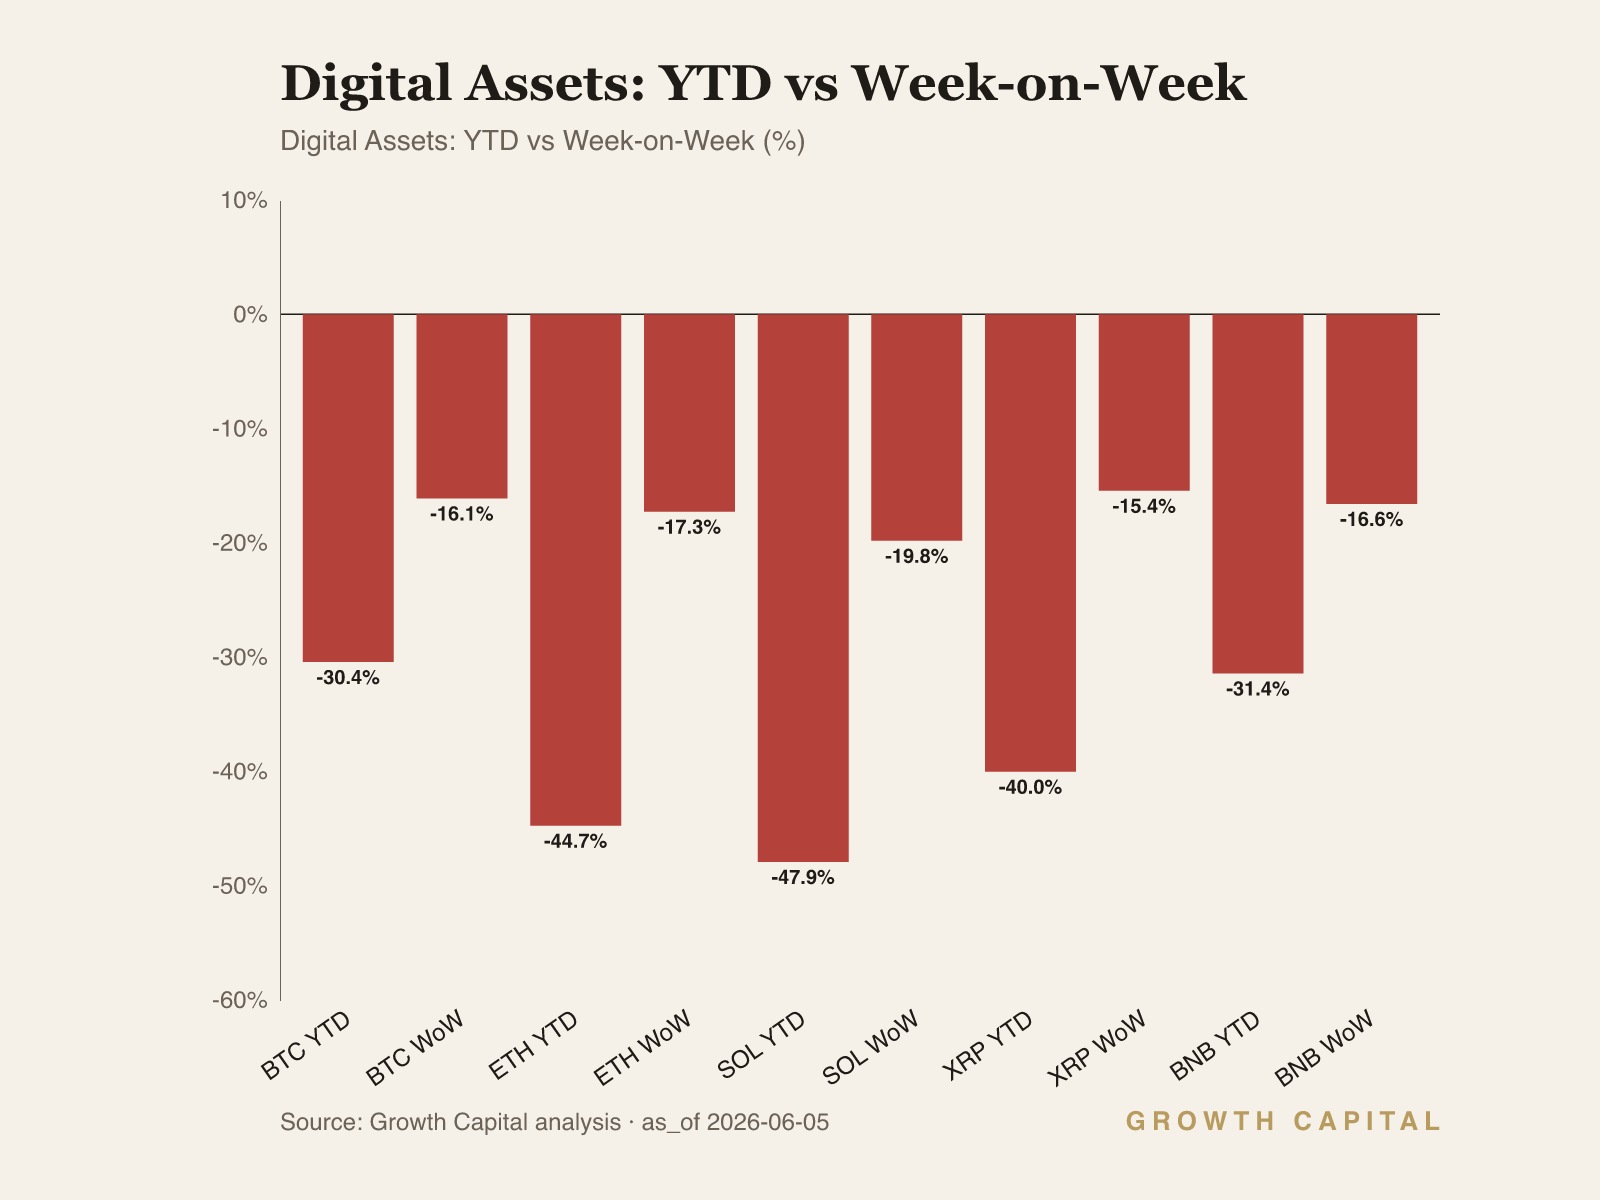
Digital assets de-risked hard and we stay underweight beta. BTC fell -16.1% WoW to 61,776 and ETH -17.3% to 1,659.7, with smart-money perps net short across every major.
Our positioning: The long end, not the policy rate, is paying the disinflation cost; we stay underweight duration and high-beta until the 10Y tells us otherwise.
A hawkish hold meets an energy unwind, and the curve does the talking
Our house view this week is a hawkish hold with a re-steepening front-to-belly curve, a regime in which the policy rate anchors the short end while term premium does the adjusting at the long end. The fed funds rate sits at 3.63% as of 1 May 2026, and the market prices essentially no move at the next meeting. The 10Y closed at 4.49%, up +22bp WoW, while the 2Y rose only +2bp WoW to 4.08%, and the published 10Y-2Y spread reads 0.42 as of 4 June 2026. Equities took the long-end move poorly, with QQQ -1.3% WoW and SPY -0.7% WoW, while DIA bucked the tape at +1.0% WoW. Brent fell -8.1% WoW to 98.29 and gold (GLD ETF) gave back -3.4% WoW. The dollar index eased -0.4% WoW to 118.88. The single thesis: the long end, not the policy rate, is repricing the disinflation cost, and that bear-steepening is the dominant cross-asset force.
Start with the observation that the 10Y added +22bp WoW to 4.49% while the 2Y barely moved at 4.08%, a divergence that widens the belly of the curve rather than the front. With the policy rate held at 3.63% and a single 25bp cut the most the market will entertain this year, the front end has little room to fall and the long end carries the entire repricing of growth and inflation risk. The mechanism runs through duration and discount rates. A higher 10Y lifts the discount rate applied to long-duration cash flows, and the most rate-sensitive equity complex re-rates first; QQQ at -1.3% WoW against DIA at +1.0% WoW is that dispersion in one print, because the Nasdaq carries the longest implied cash-flow duration in the index set. The same channel pulls TLT down -0.9% WoW even as the front end is anchored, since long Treasuries carry the convexity the 2Y does not. Our implication is to stay underweight long-duration equity beta and neutral on the front end over a one-to-three-month horizon, accepting that we give up upside if the long end mean-reverts lower. We would change this view if the 10Y broke back below 4.18%, which would signal the market re-pricing a growth scare rather than a term-premium rebuild and would argue for adding duration into the move.
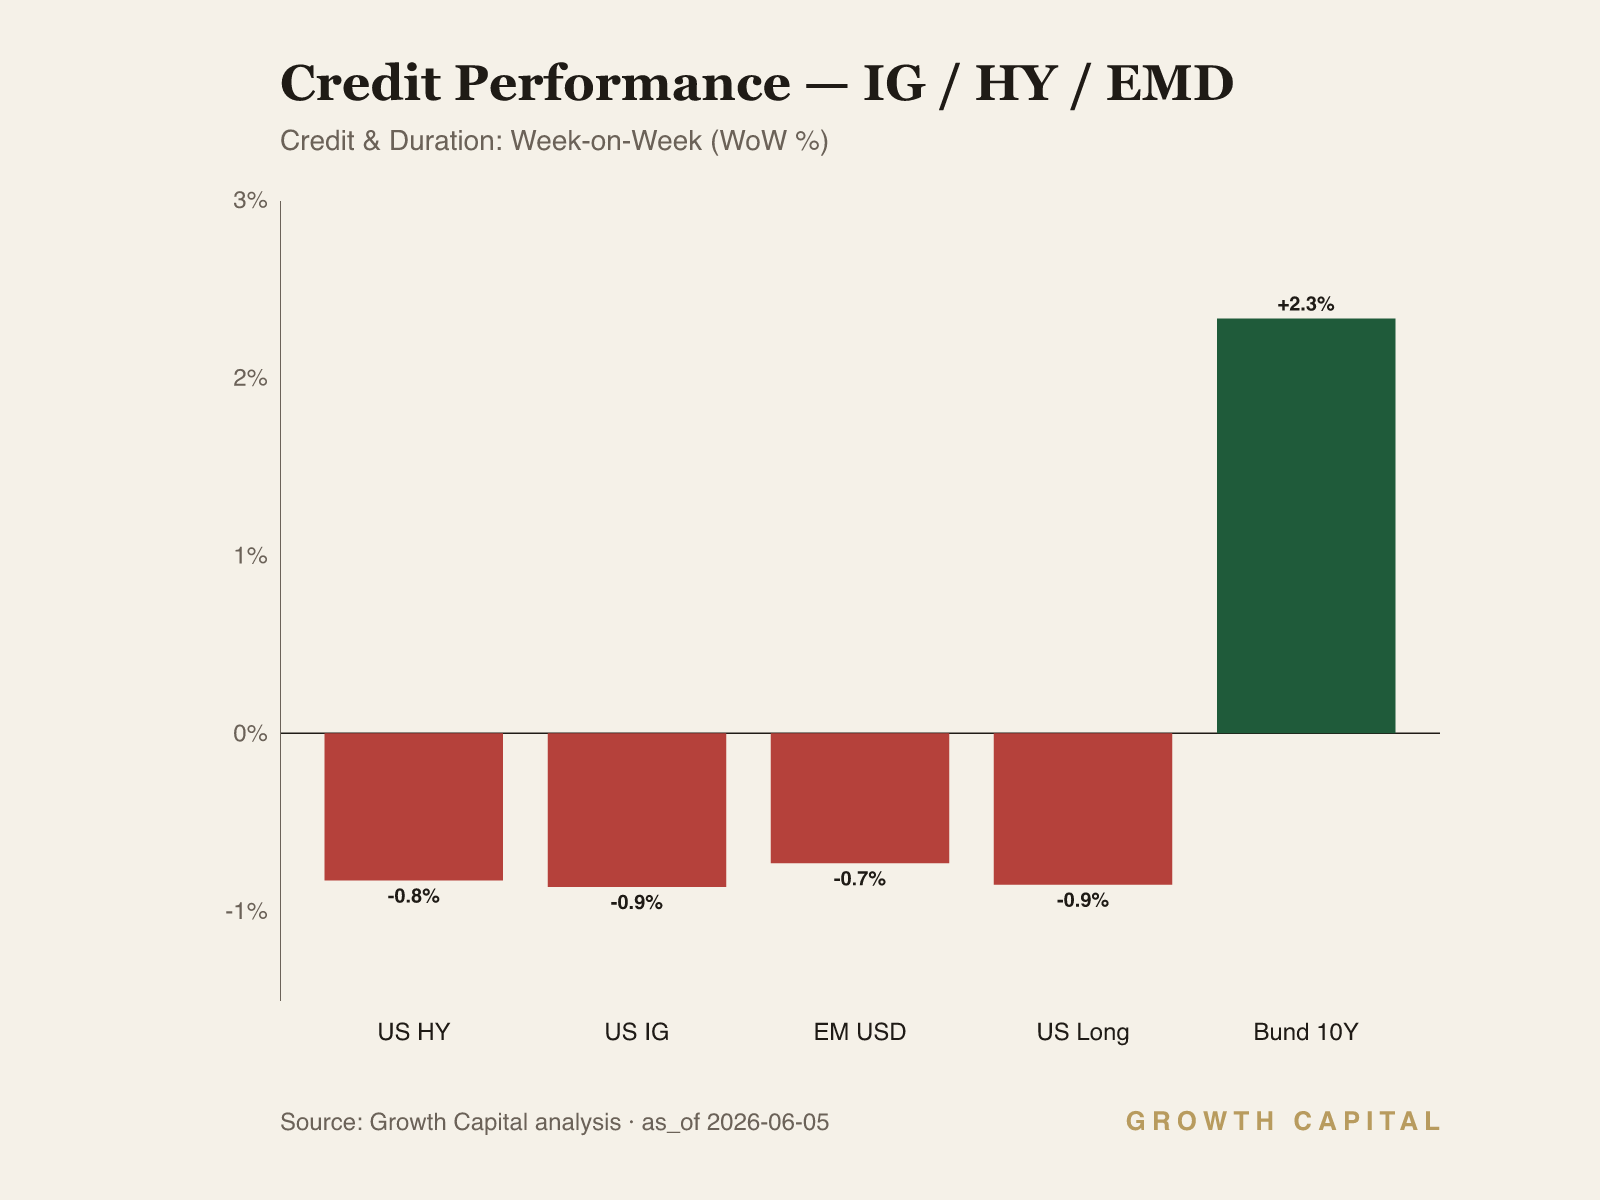
The cross-asset tape both confirms and complicates the hawkish-hold read. Brent fell -8.1% WoW to 98.29 while remaining sharply higher YTD, and that move is a risk-premium unwind, not a demand signal: a fading Strait-of-Hormuz bid removed a geopolitical premium that had been layered onto the curve. The mechanism matters for the regime label. Falling crude eases the near-term inflation impulse, which should pull the long end lower, yet the 10Y rose +22bp WoW in the same week. That contradiction resolves in favour of term premium: the long end is repricing the fiscal-and-supply path, not the energy spot. Credit confirms the caution, with HYG -0.8% WoW, LQD -0.9% WoW and EMB -0.7% WoW all moving together, a synchronous spread widening rather than an idiosyncratic move. Our view is underweight high-beta credit and underweight long-duration equities, neutral gold at -3.4% WoW after the real-yield back-up, on a one-to-three-month horizon. We would flip to neutral credit if HYG recovered toward its 52-week high of 81.32, which would signal the spread move was liquidity, not deterioration.
The dollar is the second-most-material rail this week and it argues against a pure risk-off read. DXY fell -0.4% WoW to 118.88 while EUR/USD rose +0.8% WoW to 1.1679 and USD/CHF fell -1.0% WoW to 0.7811, a coherent pattern of dollar softness against funding and reserve currencies even as US yields rose. A rising 10Y with a falling dollar tells us the long-end move is being read as term premium and fiscal supply rather than a hawkish growth surprise, because a genuine hawkish surprise would lift the dollar alongside yields. That keeps EUR/USD biased higher and supports our neutral-to-constructive stance on non-dollar reserve exposure. The risk-on signal in FX sits uneasily next to crypto's -16% week, and we resolve that toward FX: the dollar tape is the cleaner liquidity read.
What would change our view. On the downside, a 10Y break above the 52-week high of 4.67% would push us further underweight equity beta and credit, since that level would confirm a term-premium spiral feeding into funding costs and forcing leveraged de-grossing across risk assets. On the upside, a 10Y back below 4.18% paired with HYG reclaiming 81.32 would tell us the bear-steepening was a supply head-fake, and we would add duration and move credit to neutral. The named falsifier for the energy call is Brent reclaiming its WoW losses back toward 114-plus, which would re-arm the inflation impulse and invalidate the disinflation-cost framing. Until one of those triggers prints, we hold the hawkish-hold, bear-steepening regime as the load-bearing call.
Source: GrowthCapital analysis; FRED, ECB, BLS, Nansen, Hyperliquid.
Fixed Income
The week's load-bearing move is in rates: the 10Y rose +22bp WoW to 4.49% while the 2Y added only +2bp WoW to 4.08%, leaving a 41bp gap that aligns with the published 10Y-2Y spread of 0.42 as of 4 June 2026. This is bear-steepening, where the long end repriced and the front end stayed pinned by the 3.63% policy rate. The transmission runs through term premium and convexity. With the front end anchored, any new growth-and-supply information has to clear in the belly and long end, so the 10Y carries the adjustment while the 2Y, close to its 52-week high of 4.13%, has limited room to rise further. TLT fell -0.9% WoW to 85.03, sitting just above its 52-week low of 83.02, because long-duration Treasuries absorb the convexity the front end cannot. Credit moved with rates rather than against them: LQD -0.9% WoW, HYG -0.8% WoW and EMB -0.7% WoW widened together, a synchronous move consistent with funding-driven de-grossing rather than a single-name credit event. Our positioning is neutral on the front end and underweight long duration over one-to-three months, accepting reinvestment risk if the long end reverses. We would move TLT to overweight if the 10Y broke below 4.18%, which would mark the move as a growth scare and reward duration. We would go further underweight long duration if the 10Y cleared its 52-week high of 4.67%.
Commodities
Brent fell -8.1% WoW to 98.29 while still carrying a large YTD gain, and the gold proxy GLD gave back -3.4% WoW to 402.99. The crude move is a geopolitical risk-premium unwind, not a demand collapse: a fading Strait-of-Hormuz bid removed the premium layered onto the curve over prior weeks, and the spot move overstates any change in physical balance. The mechanism into inflation runs through the energy component of headline prints. A lower crude path eases the near-term inflation impulse, which on its own should pull long yields down, yet the 10Y rose +22bp WoW in the same week. That divergence tells us the rates market is pricing term premium and fiscal supply, not the energy spot, and reinforces the bear-steepening regime. Gold's give-back is the real-yield channel: with the 10Y up +22bp WoW, the opportunity cost of holding a non-yielding asset rose, and GLD re-rated lower even as the dollar softened -0.4% WoW. Natural gas data carries a cross-source divergence this week and we set it aside from the thesis. Our view is neutral gold over one-to-three months after the real-yield back-up, with no directional crude tilt given the risk-premium noise. We would turn constructive on gold if the 10Y broke below 4.18%, easing the real-yield drag. The energy-call falsifier is Brent reclaiming toward 114-plus, which would re-arm the inflation impulse.
Equities
Equities split along duration this week. QQQ fell -1.3% WoW to 729.02 and SPY -0.7% WoW to 751.50, while DIA rose +1.0% WoW to 515.75 and IWM fell -0.8% WoW to 288.02. SPY sits just below its 52-week high of 759.57 and is up +10.0% YTD; QQQ is up +18.9% YTD but reads overbought. The dispersion is the rates channel in equity form. A 10Y at 4.49%, up +22bp WoW, lifts the discount rate on long-duration cash flows, and the Nasdaq, which carries the longest implied cash-flow duration, re-rated hardest; the Dow, with shorter-duration cyclical and value cash flows, held up. This is a re-rating, not an earnings event, and it expresses a momentum-and-low-vol crowding unwind in the most extended names. Europe and Japan were quiet, with FEZ -0.1% WoW and EWJ -0.1% WoW, leaving the US long end as the marginal driver. Implied valuation is the constraint: with the 10Y near the top of its range, the equity risk premium compresses against a higher risk-free path, and the most expensive duration carries the most downside. Our view is underweight QQQ and neutral SPY over one-to-three months, with a relative preference for DIA's shorter duration. We would move QQQ to neutral if the 10Y broke below 4.18%, restoring the discount-rate tailwind to long-duration growth. We would cut SPY to underweight if the 10Y cleared 4.67%.
Digital Assets
Digital assets de-risked across the board. BTC fell -16.1% WoW to 61,776, ETH -17.3% to 1,659.7, SOL -19.8% to 66.07, XRP -15.4% to 1.13 and BNB -16.6% to 591.95, with BTC dominance at 55.43% and total market cap at $2.25T after a -3.18% 24-hour move. Each major printed a fresh 52-week low at the week's close. The mechanism is positioning-driven: with smart-money perps net short across every major on Hyperliquid, a higher real-rate path and a -16% spot week forced leveraged longs to de-gross into thinning liquidity, the classic spiral in which falling prices and shrinking funding capacity feed each other. The on-chain picture is not uniformly bearish, however. WBTC saw -$173.9M of net exchange outflows and ETH -$343.6M, patterns that historically signal accumulation off-exchange even as perps stay short. That spot-versus-perps split is the tension in the asset class right now: derivatives lean bearish while custody flows lean toward accumulation. Our view is underweight crypto beta over one-to-three months, accepting we may miss an oversold bounce, because the funding-and-liquidity setup dominates the constructive flow signal until perps positioning turns. We would move to neutral if BTC reclaimed ground with smart-money perps flipping net long and exchange outflows persisting, confirming accumulation rather than a dead-cat.
GC Views
| Asset | View | Rationale |
|---|---|---|
| US_10Y | UW | 10Y +22bp WoW to 4.49% on term premium; bear-steepening, UW long duration until a break below 4.18%. |
| SPY | N | SPY -0.7% WoW, +10.0% YTD near 52w high of 759.57; neutral as the 10Y compresses the equity risk premium. |
| GLD | N | GLD -3.4% WoW to 402.99 on the real-yield back-up; neutral until the 10Y eases below 4.18%. |
| BTC | UW | BTC -16.1% WoW to 61,776 fresh 52w low; smart-money perps net short, UW beta until positioning turns. |
| EURUSD | N | EUR/USD +0.8% WoW to 1.1679 on dollar softness; constructive lean as a rising 10Y reads as term premium. |
| US_2Y | N | 2Y +2bp WoW to 4.08% near 52w high of 4.13%, pinned by the 3.63% policy rate; neutral front end. |
| TLT | UW | TLT -0.9% WoW to 85.03 near 52w low; UW long duration, OW only on a 10Y break below 4.18%. |
| LQD | UW | LQD -0.9% WoW; widened with HYG/EMB in a funding-driven move, UW IG credit beta. |
| HYG | UW | HYG -0.8% WoW; synchronous spread widening, neutral only on a reclaim of 81.32. |
| QQQ | UW | QQQ -1.3% WoW, overbought, +18.9% YTD; longest duration re-rates hardest as the 10Y rises. |
| DIA | N | DIA +1.0% WoW to 515.75; shorter-duration cyclicals held the tape, relative preference within equities. |
On-Chain Pulse
The aggregate on-chain pattern this week is a split between bearish derivatives positioning and constructive custody flows. Smart-money traders are net short across every major perp on Hyperliquid, while exchange outflows in the largest assets point toward off-exchange accumulation. We read the split as a market in active de-grossing where leveraged shorts dominate the price tape, but where the underlying custody pattern argues against treating the move as terminal.
Bitcoin sits at the centre of the divergence. On Hyperliquid, smart traders are net short $68.3M (longs $27.4M against shorts $95.7M), and whales are net short $25.9M on $1.5B of total exposure, a far larger book than the smart-trader cohort, so the whale lean is the heavier marginal force even though its net is smaller. The on-chain side reads the other way: WBTC saw -$173.9M of net exchange outflows, roughly 3x the average pace, alongside +$124.8M of public-figure net inflows and +$21.1M from fresh wallets. That spot-versus-perps split, custody accumulation against perps shorts, is the defining BTC signal of the week. With BTC at a fresh 52-week low of 61,776 after a -16.1% WoW move, we stay underweight beta until the perps cohort flips, but we treat the outflow data as the first condition for a move to neutral.
Ethereum shows the cleanest accumulation signal under a bearish derivatives tape. ETH recorded -$343.6M of net exchange outflows over the week, the largest of any major in the intel set, a pattern that historically marks coins moving into custody rather than toward sale. That sits against smart-money perps that lean net short across the complex, the same de-grossing posture seen in BTC. ETH fell -17.3% WoW to a fresh 52-week low of 1,659.7, the steepest large-cap drawdown after SOL. The contradiction between heavy outflows and short positioning is the reason we hold ETH at supporting underweight rather than a high-conviction short. We would upgrade if the outflow pace persisted while perps funding normalised off its current lean.
Solana is the weakest major on price and the intel shows distribution rather than accumulation. SOL fell -19.8% WoW to a fresh 52-week low of 66.07, the largest drawdown in the complex, and unlike BTC and ETH the on-chain read points to net exchange inflows, coins moving toward exchanges and potential sale rather than into custody. Smart-money perps lean net short alongside the rest of the majors, so derivatives and spot flows agree on the bearish side here, without the offsetting accumulation signal. That alignment is why SOL is our least preferred large-cap this week. We stay underweight and would need both an inflow reversal and a perps flip before revisiting the call.
BNB mirrors the SOL pattern of distribution pressure. The intel flags net exchange inflows for BNB, coins moving onto venues, which we read as distribution rather than accumulation, and BNB fell -16.6% WoW to a fresh 52-week low of 591.95. Smart-money perps across the complex lean net short, so BNB carries the same bearish derivatives posture without the custody offset that supports BTC and ETH. The combination of inflows and short positioning leaves no constructive signal to lean on. We hold BNB at underweight as context within the complex, with no near-term catalyst to shift the call until exchange flows turn back toward outflows.
Frontier Watch
The frontier signal this week is in the AI-infrastructure tape that sits beneath the index moves, surfaced in our channel intelligence rather than in clean price data. The recurring observation is that optical-interconnect and CPO test-equipment capacity is a bottleneck, with full optical inspection of a single photonic integrated circuit running over 100 seconds per unit, a throughput constraint that caps how fast co-packaged-optics supply can scale into AI-network demand. The earnings dispersion underneath the QQQ -1.3% WoW move tells the same story: AI-network reliability names with genuine revenue growth are being separated from names expanding their pipeline language while missing on revenue, a quality screen reasserting itself as the long end re-rates duration. We treat this as confirmation of our underweight QQQ stance: the index carries the longest cash-flow duration, and within it the gap between profitable AI-infrastructure compounders and pipeline-narrative names widens precisely when the discount rate rises. For long-horizon allocators we favour the cash-generative interconnect and reliability layer over the speculative tier, and we read the test-equipment bottleneck as a structural margin support for the incumbents that own it rather than a near-term tradable catalyst.
What We're Watching
The 10Y is the swing variable. A break above the 52-week high of 4.67% pushes us further underweight equity beta and high-beta credit, as that level would confirm a term-premium spiral feeding funding costs and forcing leveraged de-grossing. A move back below 4.18% would mark the bear-steepening as a supply head-fake, and we would add duration via TLT and move credit to neutral as HYG reclaims 81.32. On energy, Brent reclaiming toward 114-plus would re-arm the inflation impulse and invalidate the disinflation-cost framing. In crypto, a BTC reclaim with smart-money perps flipping net long and exchange outflows persisting would move us off underweight beta.
This Week in Charts