The next Fed move is no longer assumed to be a cut. The US 2Y at 4.13% (+1.2% WoW, +19.0% YTD) prices a higher-for-longer reaction function as the FOMC heads into 17 June with CPI at a three-year high.
The ECB hiked into a supply shock while the Fed holds, widening the policy gap. The Bund 10Y fell to 3.03% (-1.3% WoW) even after a 25bp ECB hike, against a US 10Y at 4.55% (+1.3% WoW), a 152bp transatlantic spread.
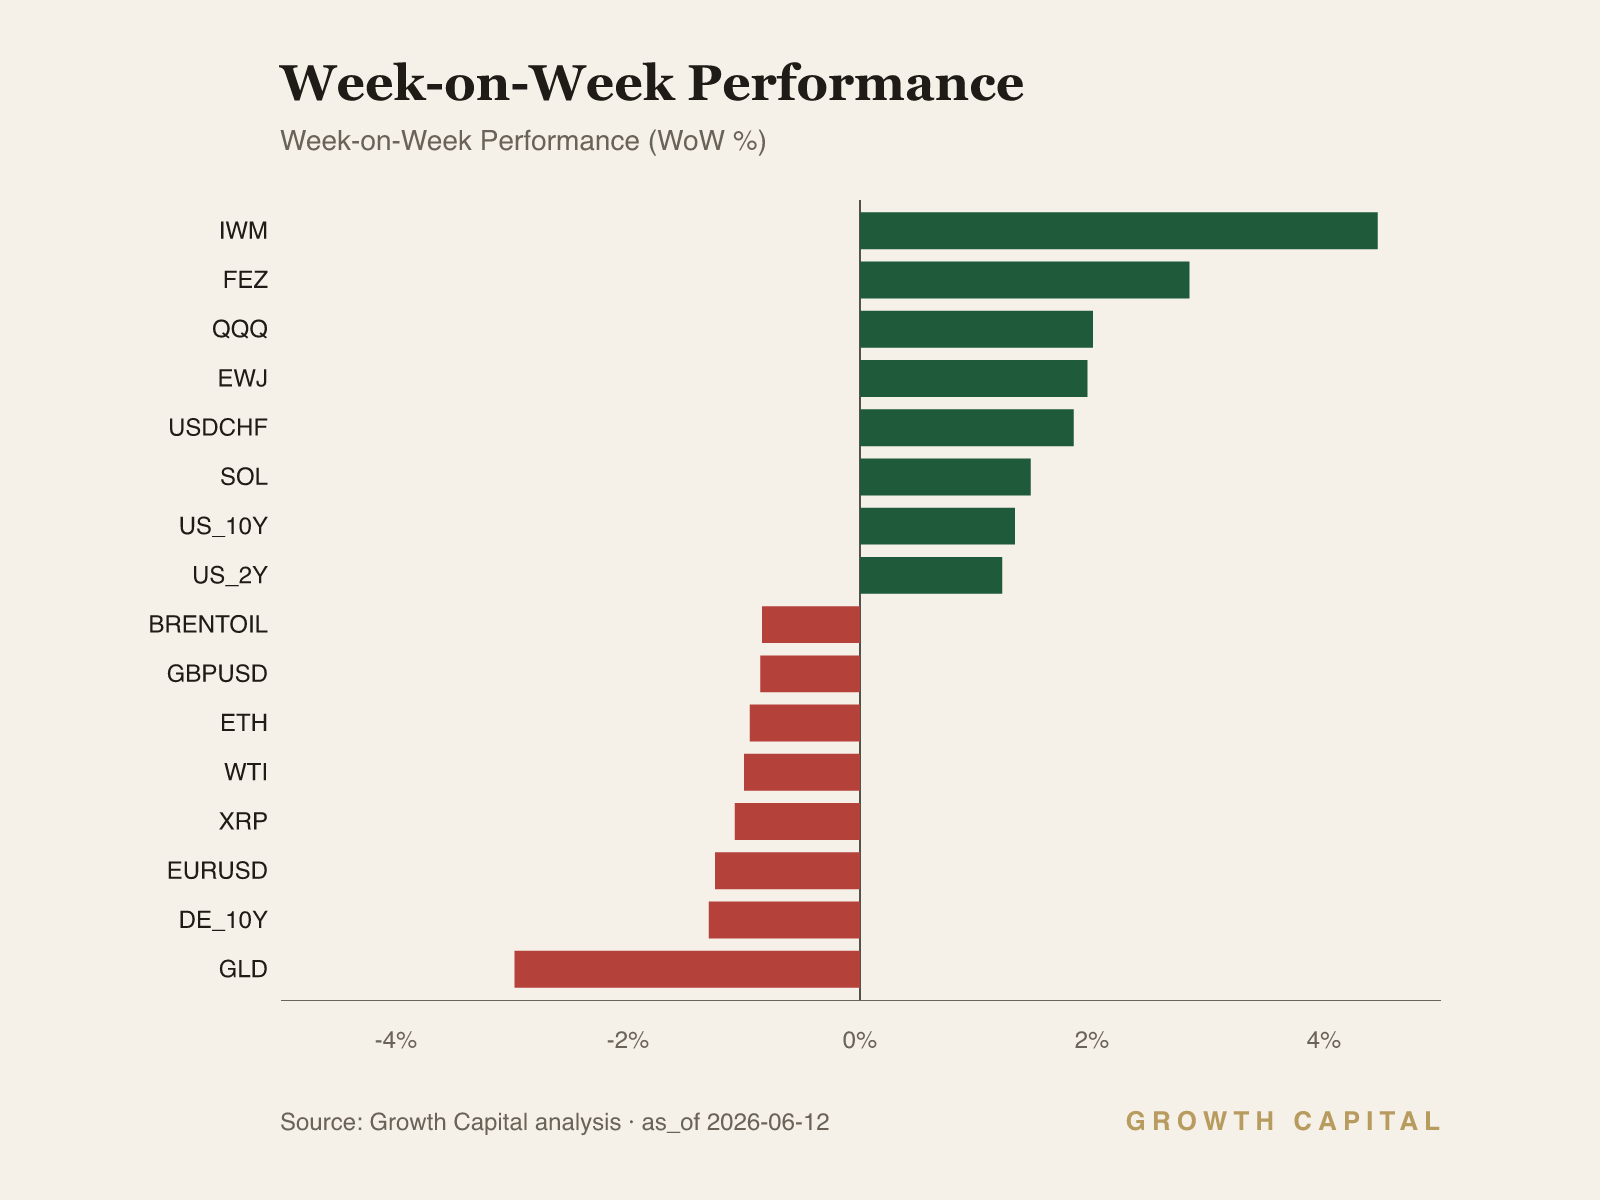
Risk assets confirm the hawkish read selectively. IWM led at +4.5% WoW and QQQ +2.0%, while GLD fell -3.0% WoW and BTC managed only +0.6% against a -28.3% YTD hole.
Our positioning: The cut cycle is over and the ECB has already hiked; we are underweight duration and treating the small-cap melt-up as a squeeze, not a re-rating.
The cut cycle is over; the question is now whether the next move is a hike
We read this week as a hawkish-hold regime hardening into an inflation scare, with the rates complex repricing the entire forward path rather than a single meeting. The US 2Y closed at 4.13%, up +1.2% WoW and an arresting +19.0% YTD, while the 10Y sits at 4.55%, up +1.3% WoW and +8.6% YTD and pressed against its 52-week high of 4.67%. The 10Y-2Y gap of 42bp (10Y 4.55% versus 2Y 4.13%) is positive but thin, and the macro feed marks it at 0.4 as of 11 June. With fed funds at 3.63% and CPI running at a three-year high into the 17 June FOMC, the market is no longer underwriting the cut that was consensus six months ago. The ECB has already moved, hiking 25bp to a 2.25% deposit rate, the first major-central-bank hike since 2023. Our house view is that the marginal policy surprise is now to the upside on both sides of the Atlantic, and that duration is the wrong place to reach for carry.
The front end is doing the analytical work, and the channel runs from the policy reaction function through real-rate expectations into the belly of the curve. A 2Y at 4.13% that has climbed +19.0% YTD tells us the market has repriced not one cut but the whole easing trajectory, because the 2Y is mechanically an average of expected overnight rates over its life plus a term premium. When an oil-driven inflation impulse lands on a labour market still printing 159,001 payrolls and 4.3% unemployment, the Fed's loss function tilts toward holding real rates restrictive rather than insuring against a slowdown that the hard data does not yet show. That repricing transmits up the curve: the 10Y at 4.55% has risen far less in percentage terms (+8.6% YTD) than the 2Y, which is why the curve has flattened toward the 42bp gap we observe rather than bull-steepening. We are underweight long-duration Treasuries on a three-to-six-month horizon, expressed through a cautious stance on TLT at 85.51 (-1.7% YTD), accepting the carry give-up because the convexity risk into a hawkish FOMC is asymmetric. We would reverse to neutral duration if the 10Y breaks back below 4.30% on a soft core CPI print, which would signal the inflation scare is fading and the cut path is being rebuilt.
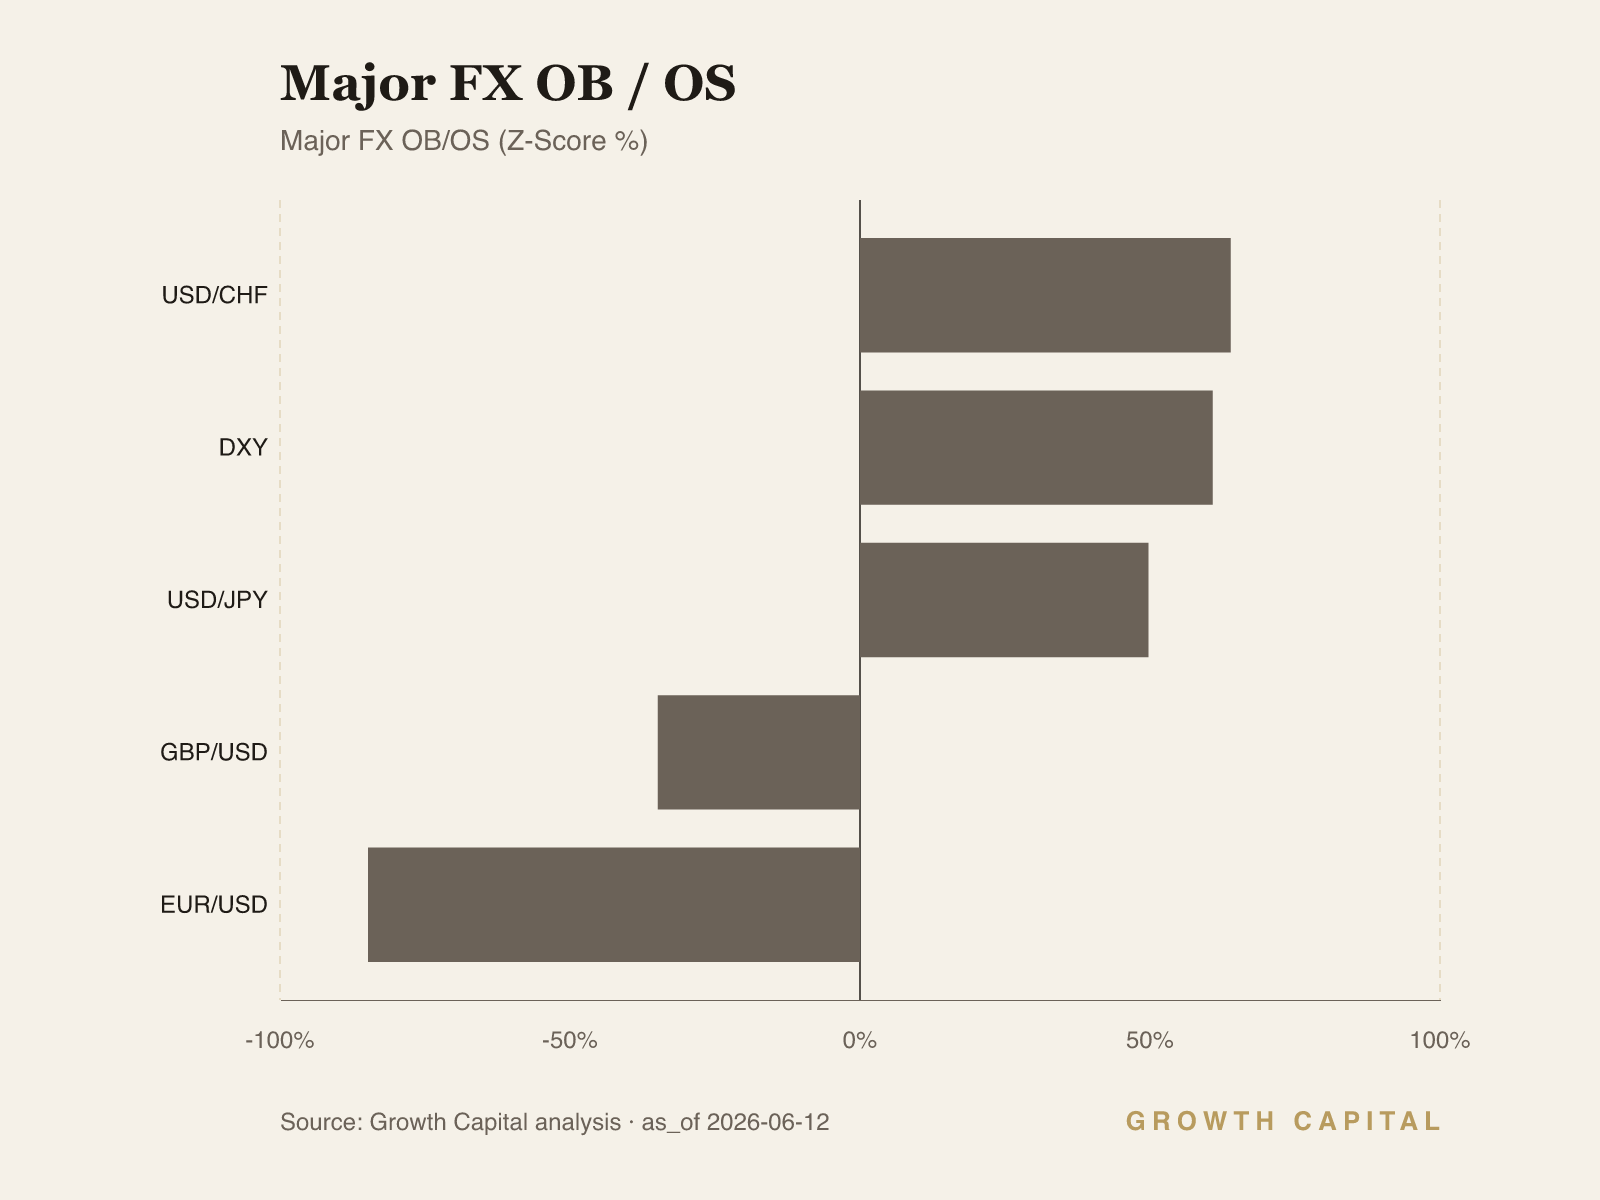
The cross-asset tape both confirms and complicates that read, and the tension resolves in the dollar. EUR/USD at 1.1533 is down -1.2% WoW and -1.7% YTD even after the ECB delivered its hike, which on a naive rate-differential view should have lifted the euro. The mechanism is that a hike forced by an energy-supply shock is not the same as a hike that signals growth confidence: the ECB trimmed its own growth path to 0.8% for 2026 while raising the inflation track to 3.0%, so the rate move is defensive, and FX markets price the stagflationary mix as euro-negative through the terms-of-trade channel. A euro-area that imports energy into a supply shock sees its external balance deteriorate, capital favours the higher-real-yield dollar bloc, and DXY firms to 120.0831 (+1.0% WoW). This confirms the P1 hawkish regime: the dollar is the cleaner expression of US rate leadership than the curve itself. We are neutral EUR/USD with a downside skew toward the 52-week low of 1.1397, and we would flip constructive on the euro only if EUR/USD reclaims 1.17, which would tell us the market has stopped treating the ECB hike as a defensive move.
Equities are the harder reconciliation. SPY at 740.56 is up only +0.4% WoW but +8.4% YTD, IWM ripped +4.5% WoW to tag its 52-week high, and QQQ added +2.0% to sit slightly overbought. A risk-on small-cap melt-up sits awkwardly against a hawkish-hold rate tape, and the intel surface flags genuine fragility beneath the index, with the Nasdaq complex showing active liquidation despite the ceasefire-driven bounce. We read the IWM move as a momentum and short-covering impulse on Iran de-escalation rather than a durable re-rating, and we are neutral US large-cap beta and underweight the small-cap chase here, accepting we may lag a further squeeze.
The falsifiers are specific. On the downside, a 10Y close above the 52-week high of 4.67% would tell us the inflation scare has become a term-premium event rather than a policy-path repricing, and we would cut equity beta further and lengthen quality. On the upside, a soft core CPI ahead of 17 June that drags the 2Y back below 3.90% would invalidate the higher-for-longer thesis and argue for adding duration and cyclical risk. We are watching the dollar as the tell: a DXY break above the 52-week high of 121.9171 would confirm the rate-leadership regime is intensifying rather than peaking.
Source: GrowthCapital analysis; data from FRED, ECB, and exchange/ETF snapshots as of 12 June 2026.
Fixed Income
The US 2Y at 4.13% is the cleanest read on the regime shift this week, up +1.2% WoW and +19.0% YTD, while the 10Y at 4.55% (+1.3% WoW, +8.6% YTD) sits 12bp below its 52-week high of 4.67% and screens slightly overbought. The Bund 10Y moved the other way, falling -1.3% WoW to 3.03% even after the ECB's 25bp hike, leaving a 152bp US-over-Germany spread (4.55% versus 3.03%). The mechanism is divergent reaction functions: the US front end prices a Fed that has finished cutting and may hike, because an oil-led inflation impulse on a 4.3% unemployment backdrop tilts the loss function toward restriction. The Bund rallies because the ECB's hike was forced by a supply shock against a downgraded 0.8% 2026 growth path, so the market reads the European terminal rate as near and the growth cost as real. That divergence transmits directly into relative duration positioning. We are underweight long US duration through TLT at 85.51 (-1.7% YTD), accepting negative carry against the convexity risk into the 17 June FOMC, and we hold IG credit via LQD at 108.815 (+0.6% WoW, -1.2% YTD) as the higher-quality way to earn spread without taking the full rate beta. EM USD sovereigns via EMB at 96.24 (+0.9% WoW) are the relative-value standout, flat on the year while DM duration bleeds. We reverse the duration underweight if the 10Y breaks below 4.30% on a soft core print, which would signal the inflation scare is fading.
Forex
EUR/USD at 1.1533 fell -1.2% WoW and -1.7% YTD in the same week the ECB hiked 25bp, the cleanest evidence that this week's regime is dollar-led rather than rate-differential-led. The DXY firmed +1.0% WoW to 120.0831, holding within range of its 52-week high of 121.9171, while USD/CHF rose +1.8% WoW to 0.7955 and USD/JPY pushed to 160.26, sitting exactly on its 52-week high. The mechanism runs through the character of the ECB hike rather than its size: a hike forced by an energy-supply shock against a trimmed 0.8% growth path signals defence, not confidence, so the euro cannot capture the rate move and the terms-of-trade deterioration from imported energy dominates the FX print. Capital rotates toward the higher-real-yield dollar bloc, and DXY firms as the counterpart. USD/JPY at its 52-week high is the carry expression of the same regime, with the rate gap intact and risk sentiment supportive after Iran de-escalation. We are neutral EUR/USD with a downside skew toward the 52-week low of 1.1397, and neutral GBP/USD at 1.336 (-0.9% WoW), which is tracking risk headlines more than UK fundamentals. We turn constructive on the euro only on a reclaim of 1.17, which would mean the market has stopped pricing the ECB hike as defensive and is rewarding the rate path. A DXY break above 121.9171 would instead confirm dollar-leadership intensifying.
Equities
SPY at 740.56 gained only +0.4% WoW but holds +8.4% YTD and sits below its 52-week high of 759.57, while the risk appetite this week concentrated in the lower-quality, higher-beta corners. IWM jumped +4.5% WoW to print its 52-week high of 294.22, QQQ added +2.0% to 719.22 and now screens slightly overbought, and DIA lagged at +0.5%. The mechanism is a momentum and short-covering impulse on Iran de-escalation rather than an earnings-driven re-rating: a one-factor geopolitical relief rally lifts the most heavily-shorted small-cap and high-beta names fastest, which is why the Russell outran the S&P by roughly four points of weekly return. That pattern is fragile against a hawkish-hold rate backdrop, because small-caps carry the most floating-rate debt and are the most exposed to a 2Y that has risen +19.0% YTD. The intel surface flags active liquidation in the Nasdaq complex beneath the ceasefire bounce, consistent with a rally settling in the lower half of its daily range. We are neutral US large-cap beta through SPY and FEZ at 68.78 (+2.8% WoW), and underweight the small-cap chase via IWM at its 52-week high, accepting we may lag a further squeeze. EWJ at 92.5 (+2.0% WoW, +13.7% YTD) is the cleaner risk-on expression on Asia-Pacific follow-through. We cut equity beta further if the 10Y closes above 4.67%.
Digital Assets
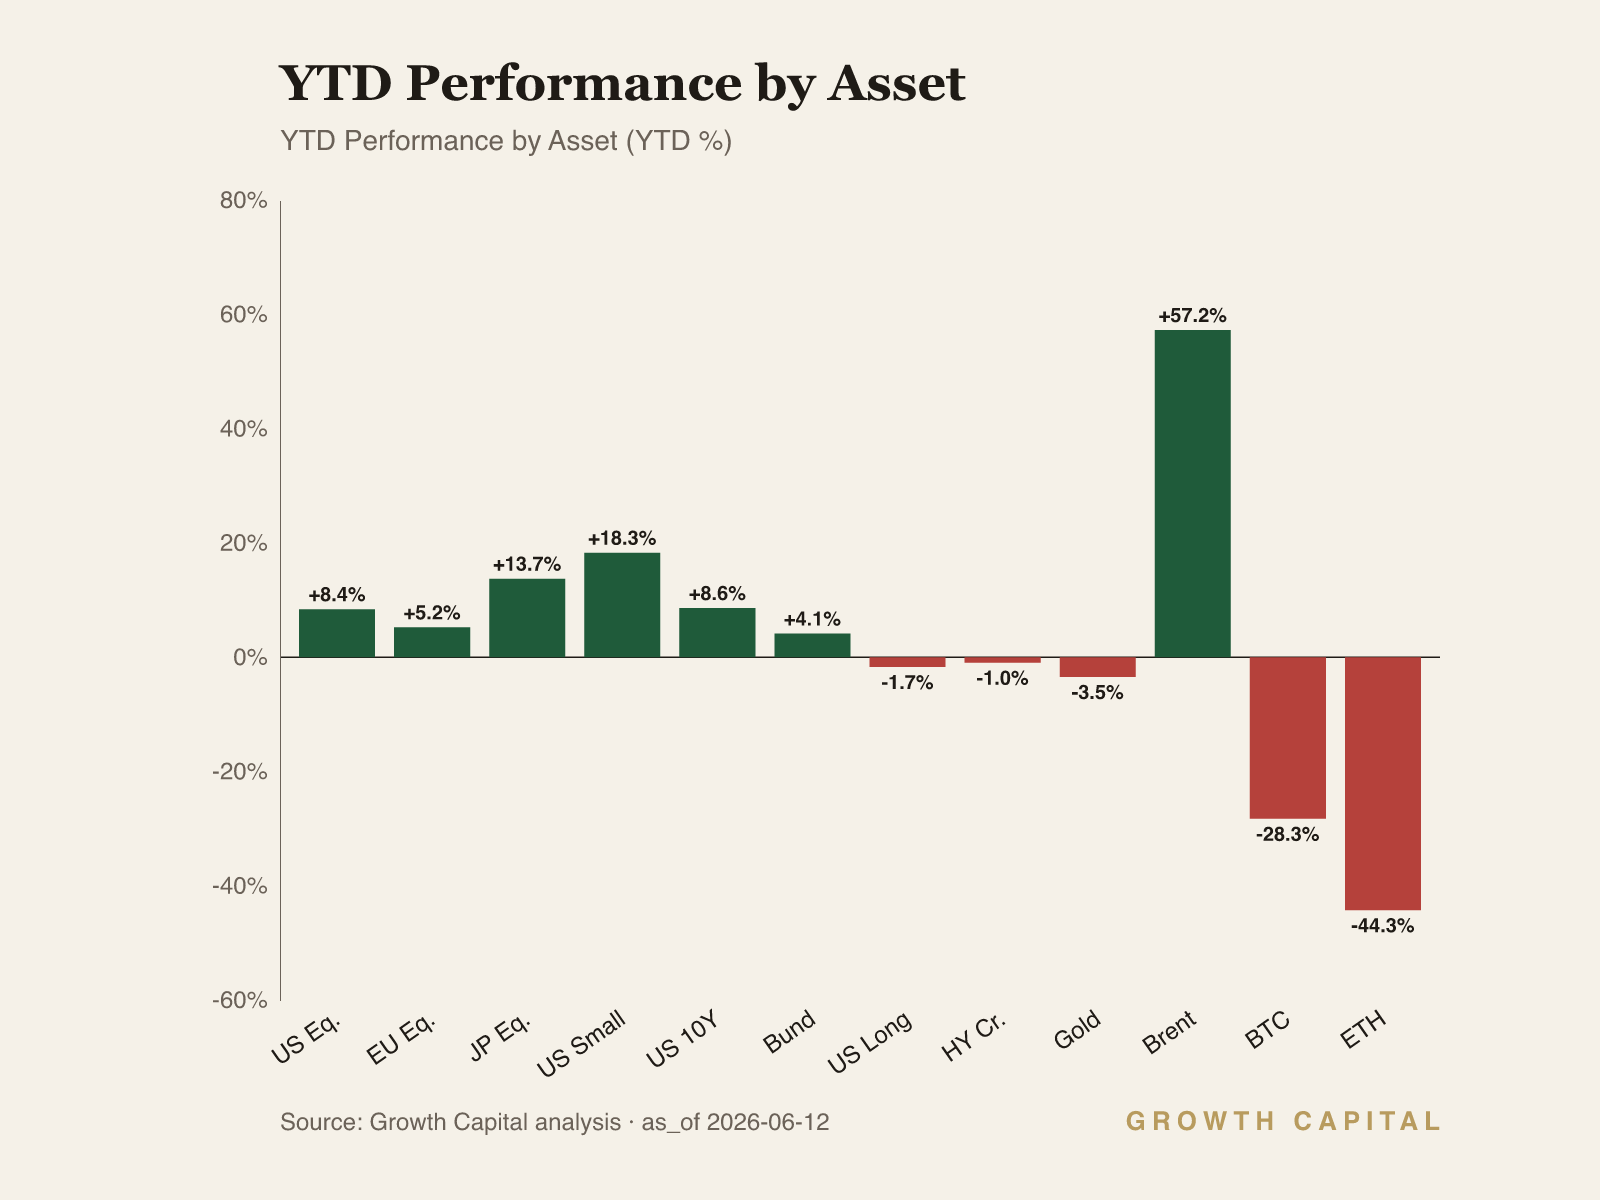
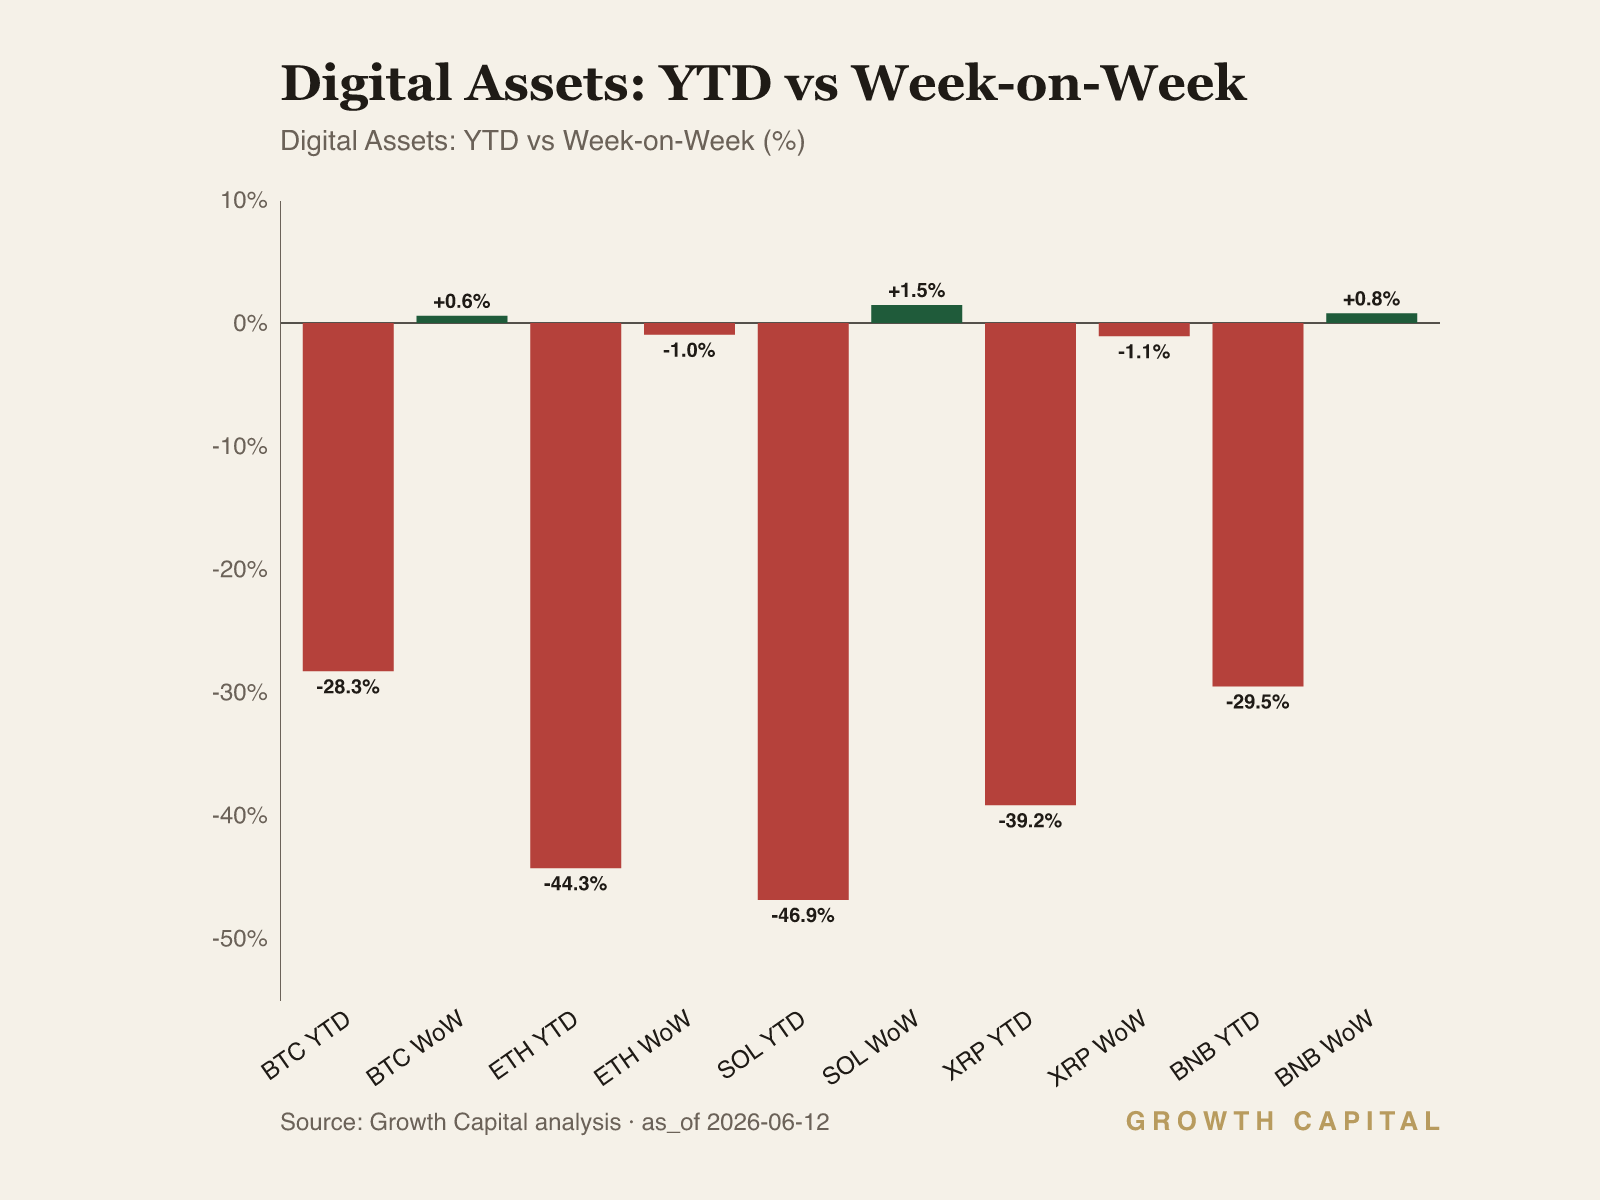
BTC at 63,673.3 rose +0.6% WoW but remains in a -28.3% YTD hole, sitting just above its 52-week low of 60,863.1 and far below the 124,744.5 high, the clearest sign this is a damaged-momentum complex, not a risk-on participant. ETH fell -0.9% WoW to 1,673.47 and is down -44.3% YTD, SOL is -46.9% YTD at 67.402 despite a +1.5% WoW bounce, and XRP slipped -1.1% WoW. BTC dominance at 55.89% confirms capital is hiding in the largest asset rather than rotating down the risk curve. The mechanism is a positioning unwind that the front-running derivatives cohort has not faded: smart traders on Hyperliquid run net short BTC by $118.5M against only $25.8M of longs, a 5.6x short skew, while whales sit near-neutral. That divergence against on-chain accumulation (WBTC top-PnL wallets showing a $50M net inflow, roughly 14x the average, and $47.9M of exchange outflows) is the tension: spot is being accumulated while perps lean short. We are underweight the altcoin complex, where the YTD damage and persistent short positioning offer no entry, and neutral BTC as a tactical contrarian hold given the spot-accumulation signal. We turn constructive on BTC only on a reclaim and hold above its prior range, and we would cut to underweight on a break of the 60,863.1 52-week low.
GC Views
| Asset | View | Rationale |
|---|---|---|
| US_10Y | UW | 10Y at 4.55%, 12bp below the 4.67% 52w high; convexity risk into a hawkish 17 June FOMC is asymmetric. |
| SPY | N | +8.4% YTD but only +0.4% WoW; large-cap beta fine, the small-cap melt-up is a squeeze we won't chase. |
| GLD | N | GLD -3.0% WoW, -3.5% YTD as ceasefire optimism drains safe-haven bid; slightly oversold but no rate tailwind. |
| BTC | N | -28.3% YTD but spot accumulation ($50M top-PnL inflow) versus perp shorts; tactical contrarian hold, not a chase. |
| EURUSD | N | 1.1533, -1.2% WoW despite ECB hike; defensive hike skews us toward the 1.1397 low until 1.17 reclaims. |
| US_2Y | UW | 2Y at 4.13%, +19.0% YTD prices the end of the cut cycle; front-end carry not worth the hike risk. |
| DE_10Y | N | Bund 3.03%, -1.3% WoW even post-hike; growth downgrade caps the European terminal rate. |
| TLT | UW | 85.51, -1.7% YTD; long-duration convexity wrong into a hawkish-hold FOMC. |
| DXY | OW | 120.0831, +1.0% WoW; cleanest expression of US rate leadership versus a defensive ECB. |
| USDJPY | N | 160.26 on its 52w high; carry intact but intervention risk caps the upside. |
| QQQ | N | 719.22, +2.0% WoW and slightly overbought; tech bounce fragile with liquidation beneath the index. |
| IWM | UW | 294.22 at its 52w high, +4.5% WoW; floating-rate-heavy small-caps most exposed to a +19% YTD 2Y. |
On-Chain Pulse
The cross-asset on-chain pattern this week is a clean split between derivatives and spot. The fast-money derivatives cohort runs net short across all five majors on Hyperliquid, while on-chain flows show accumulation concentrating in BTC and ETH proxies rather than distribution. Whales sit closer to neutral than the smart-trader cohort, leaving the most aggressive bearish positioning in the smart-money perp book against a spot tape that is quietly being bought.
BTC carries the sharpest divergence in the complex. Smart traders on Hyperliquid are net short $118.5M, with $25.8M of longs against $144.3M of shorts, a 5.6x short skew that is the most one-sided positioning across the majors. Whales are far larger but near-neutral, net short only $10.6M on $1.7B of total exposure ($825.8M long versus $836.4M short), so the directional conviction is in the smaller, faster book rather than the size. Against that perp short lean, the spot picture is the opposite: WBTC top-PnL wallets show a $50M net inflow, roughly 14x the average, and exchange wallets show $47.9M of net outflows, both accumulation signals. That spot-versus-perps split is the tension to trade. We are neutral BTC as a tactical contrarian hold, reading the spot accumulation as the more durable signal while respecting that the fast money is positioned for another leg down.
ETH shows the same cohort lean with a weaker tape. Smart traders on Hyperliquid are net short ETH by $71.6M, consistent with the broad derivatives bearishness across the majors, and the price action confirms the weakness with ETH down -0.9% WoW and -44.3% YTD. On-chain, ETH sits in the accumulation camp alongside WBTC per the flow data, so the spot-versus-perps divergence repeats: derivatives lean short while spot wallets add. The open question is whether the on-chain accumulation can absorb the perp short pressure given how much YTD damage the asset carries. We are underweight ETH despite the spot signal, because the -44.3% YTD drawdown and the persistent smart-money short give no margin of safety at this level until price reclaims a higher range.
SOL, XRP and BNB share the broad derivatives short posture without the offsetting on-chain accumulation story that BTC and ETH carry, which is why we treat them as the lower-conviction tail of the complex. SOL bounced +1.5% WoW to 67.402 but is the worst of the majors at -46.9% YTD, a level the short-positioned derivatives cohort has not faded. XRP fell -1.1% WoW and is -39.2% YTD, and BNB is the least-damaged at -29.5% YTD with a +0.8% WoW gain. With BTC dominance at 55.89%, capital is hiding in the largest asset rather than rotating down the curve into these names. We are underweight SOL and XRP and neutral BNB, treating the WoW bounces as noise inside intact downtrends rather than evidence of a cohort shift toward the alts.
Frontier Watch
The week's frontier signal is in the AI-infrastructure supply chain rather than the index. The intel surface flags a single hyperscaler multi-rail order and 40% revenue growth with 290% EPS growth at a key optical-networking name, alongside a co-packaged-optics test bottleneck where full 100% inspection of a single photonic integrated circuit runs over 100 seconds, a throughput constraint that gates the CPO ramp regardless of demand. That pairing matters: the demand signal from hyperscaler multi-rail commitments is real, but the test-equipment chokepoint is the binding constraint on how fast the optics supply chain can scale into it. We read this as confirmation that the AI capex cycle is migrating from compute toward networking and interconnect, where the scarcity is shifting from GPUs to the optical layer that links them. The relevant frame for allocators is that this capex is increasingly financed through off-balance-sheet structures that channel private credit into AI infrastructure, creating funding links between hyperscalers and non-bank lenders that did not exist in prior cycles. Those structures strengthen returns on the way up and concentrate refinancing and guarantee risk on the way down, which is the late-cycle credit dynamic we are most attentive to. We have no tradeable snapshot price on these frontier names, so this is a framing and watch item rather than a position: the signal to monitor is whether the networking-capex acceleration broadens beyond a single name's backlog into sustained order flow, and whether the private-credit financing channel shows any refinancing stress as rates hold higher for longer.
What We're Watching
The 17 June FOMC and the core CPI print into it are the pivot. If the 10Y closes above its 52-week high of 4.67%, we read the inflation scare as a term-premium event, cut equity beta further, and lengthen quality. If a soft core print drags the 2Y back below 3.90%, the higher-for-longer thesis is invalidated and we add duration and cyclical risk. On FX, a DXY break above 121.9171 confirms US rate leadership intensifying; a EUR/USD reclaim of 1.17 would tell us the market has stopped pricing the ECB hike as purely defensive. On crypto, a BTC break of the 60,863.1 52-week low flips us to underweight.
This Week in Charts