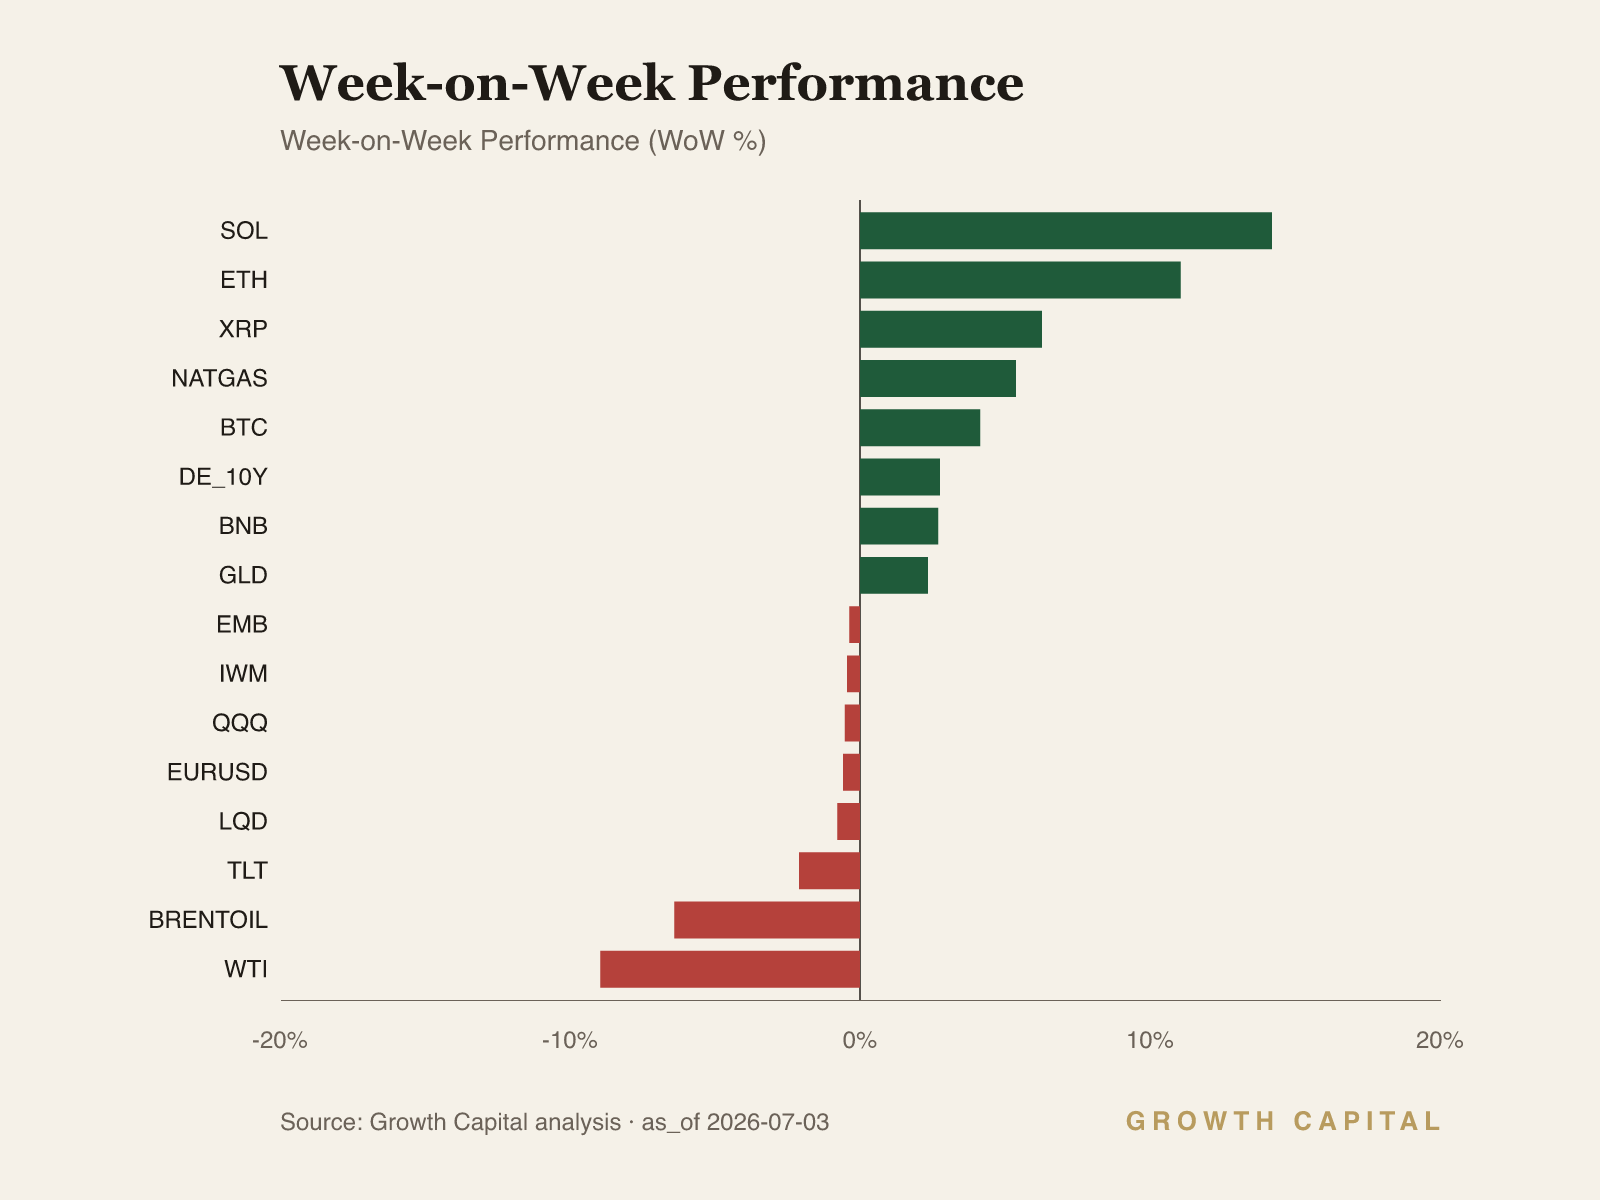
The rates story is a hawkish hold, not a pivot. The US 2Y sits at 4.17% (+1.5% WoW, +20.2% YTD) against a 3.63% policy rate, pricing in a Fed that has closed the door on near-term easing.
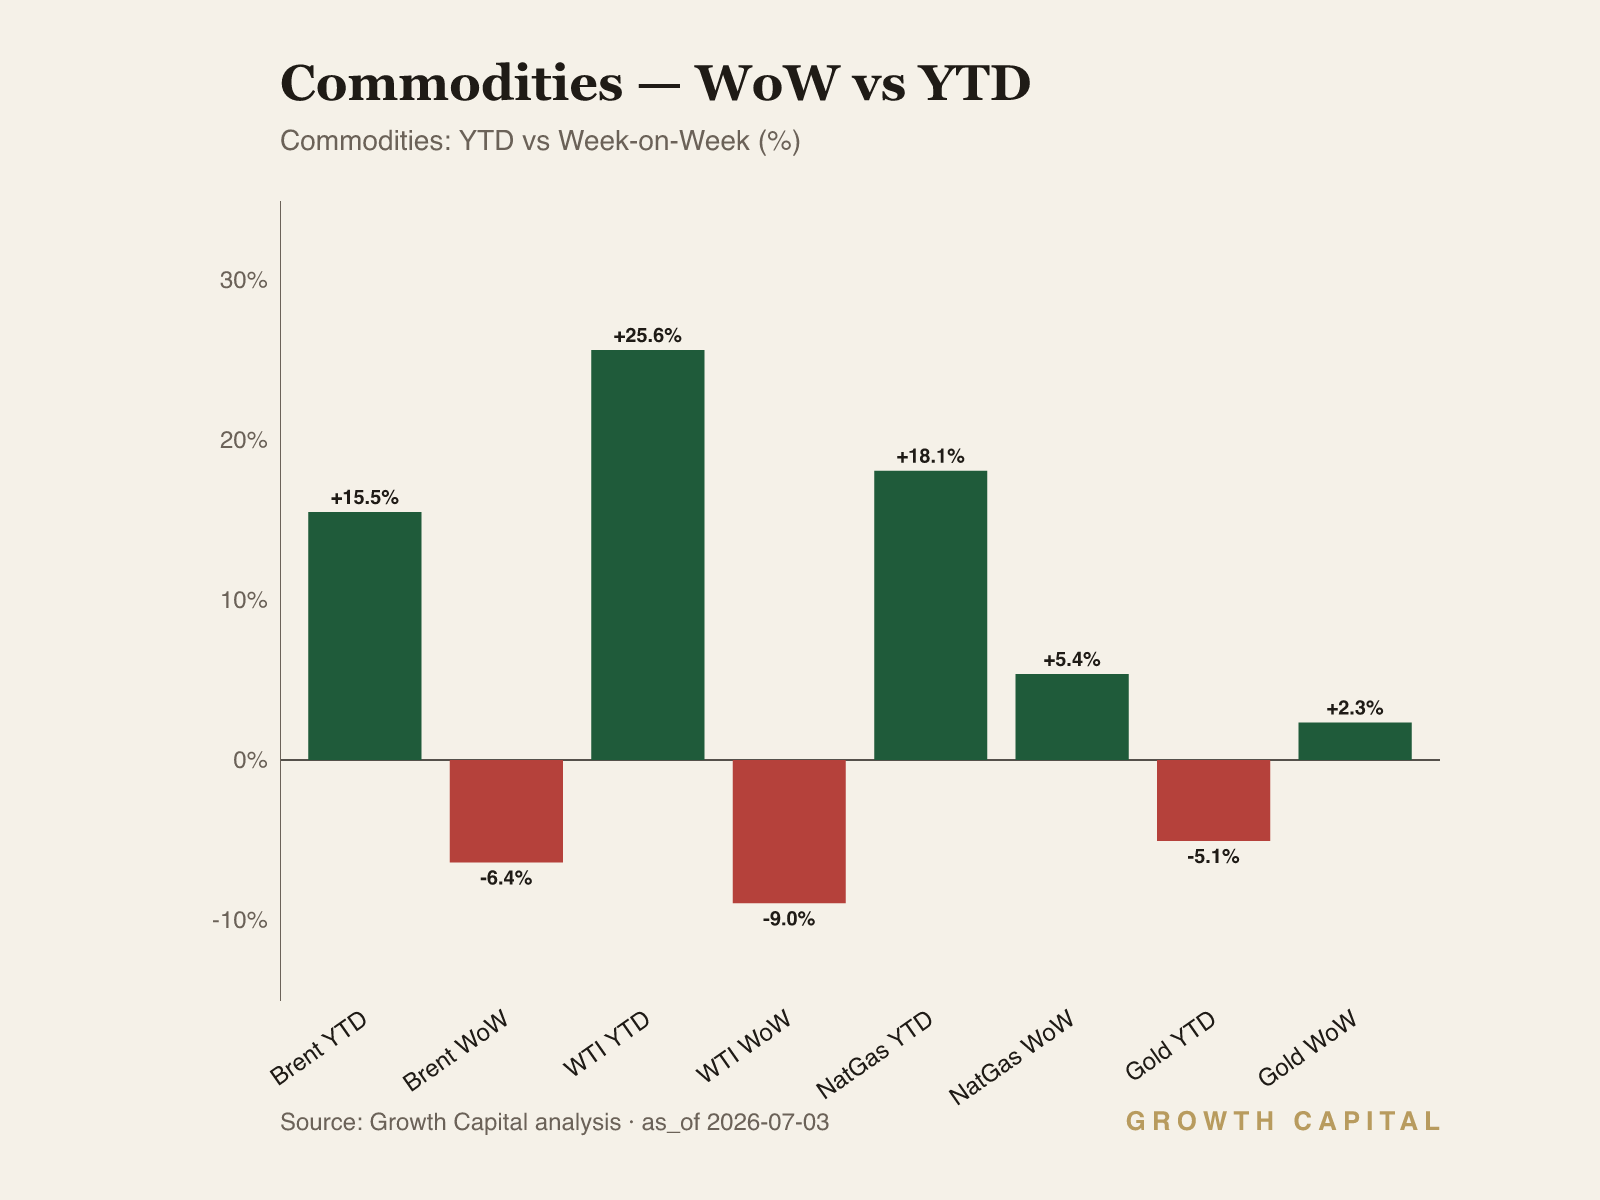
Crude's war premium is gone and it is deflationary at the margin. Brent at $71.59 fell -6.4% WoW even as it holds +15.5% YTD, removing the supply-shock tail that had underpinned the disinflation-delay thesis.
Gold and duration disagree, and we side with gold. GLD rose +2.3% WoW to $378.13 while TLT fell -2.1%, a split we read as a monetary-hedge bid rather than a growth-scare bid.
Our positioning: Warsh has dimmed the cuts while crude sheds its war premium; own the disinflation relief through gold, not duration.
A hawkish hold meets a collapsing energy premium
The week resolves into a hawkish-hold regime with a deflating energy tail. The Fed funds rate sits at 3.63% and the 2Y Treasury at 4.17%, up +1.5% on the week and +20.2% YTD, a front-end that refuses to price the cuts the equity tape keeps reaching for. Fed communications at the Sintra forum leaned explicitly against near-term easing, and the front end has taken that at face value. At the same time Brent shed -6.4% WoW to $71.59 as the Strait of Hormuz risk premium unwound, a move that removes the supply-shock argument for delayed disinflation. The result is a market caught between a policy anchor that is firm and a cost-push impulse that is fading fast. Our single house view: the front end is correctly priced and the long end is not, and we lean underweight duration into the mispricing.
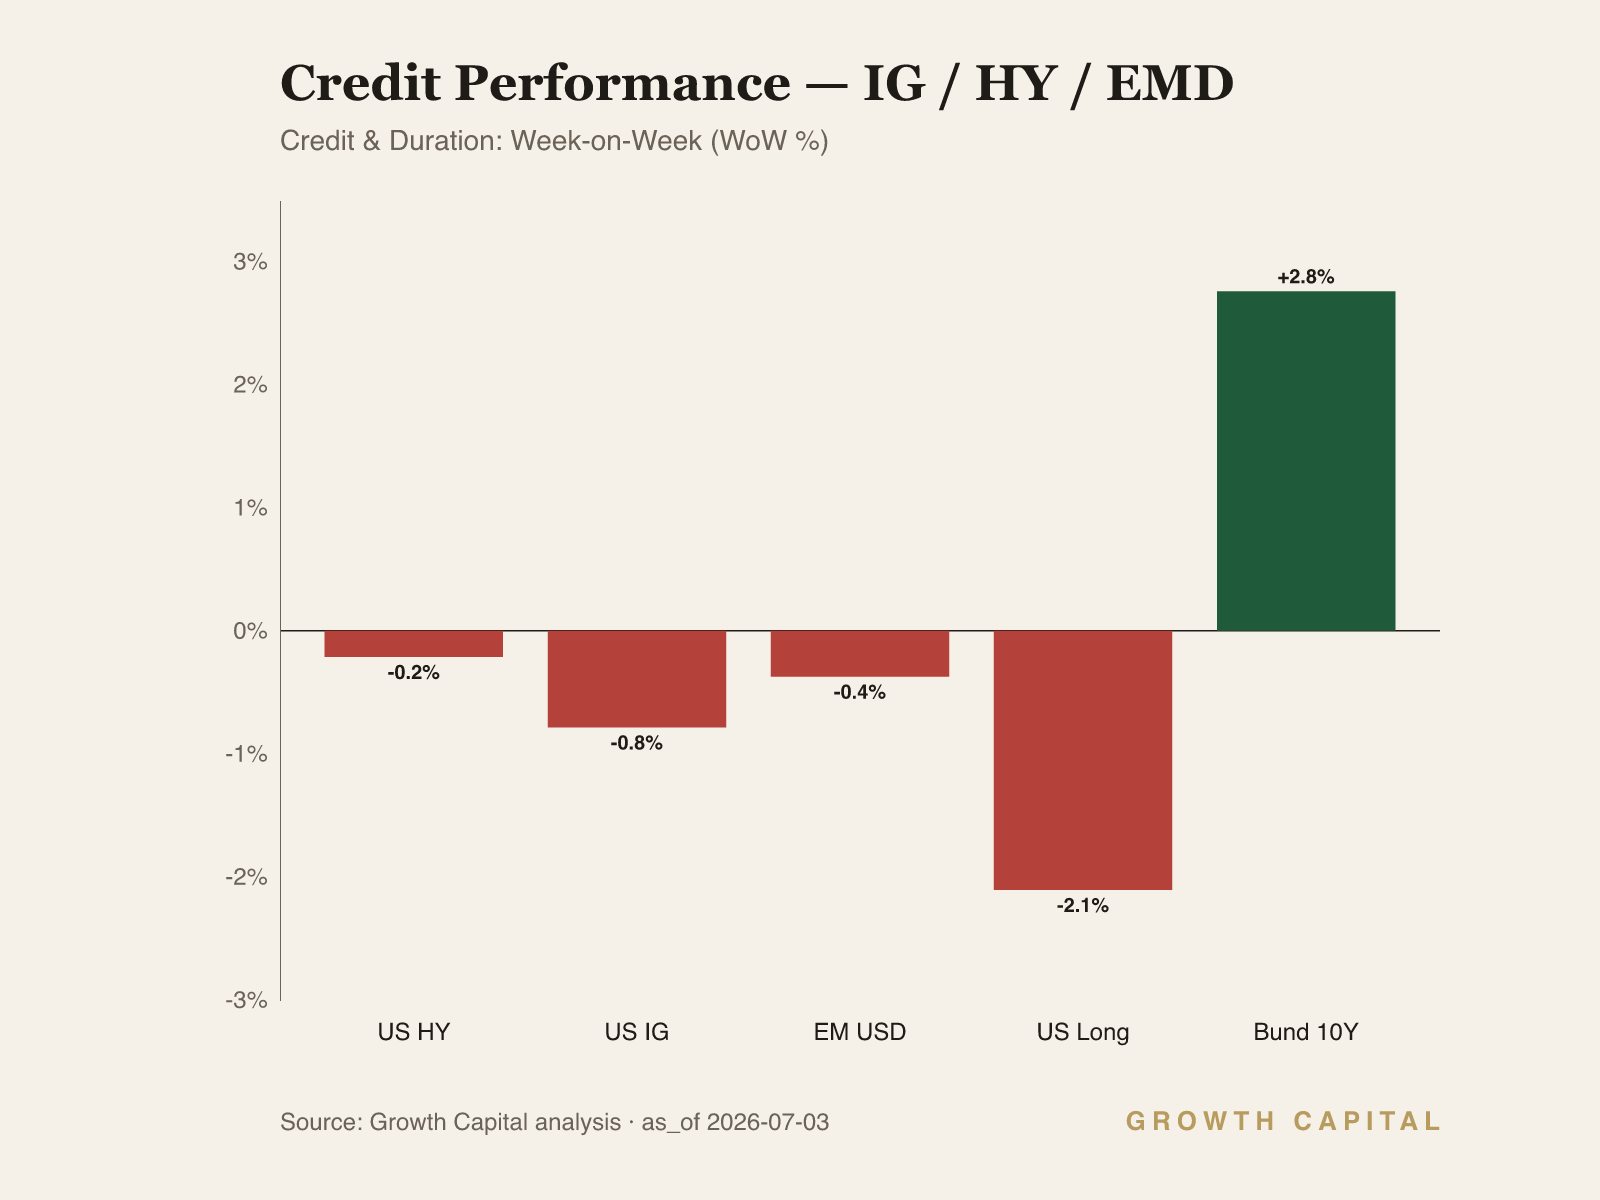
Start with the front end, because it is the load-bearing observation. The 2Y at 4.17% is +20.2% YTD and sits just below its 52-week high of 4.24%, while the 10Y at 4.48% is up only +1.6% WoW and +6.9% YTD, leaving the 10Y-2Y gap at roughly 31bp on those two snapshot legs. The transmission runs from the policy reaction function into the front end first: when a central bank signals it will hold to defend a 2% target, the marginal dealer of duration reprices the near contracts before the term structure adjusts, and the curve bear-flattens from the short end. That flattening is exactly what a hawkish hold produces, and it is not what a growth scare produces, which would steepen via front-end rallies. The pass-through to term premium is incomplete: the 10Y has barely moved while the 2Y has done the work, which tells us the long end is still discounting cuts the policy signal does not support. We are underweight duration via TLT, which fell -2.1% WoW to $85.51 and is -1.7% YTD, and we accept the carry cost of that stance over a one-to-two quarter horizon in exchange for convexity if the long end catches down to the policy signal. We would reverse to neutral duration if the 10Y broke below its 52-week low of 3.97%, which would signal the market has moved from pricing a hold to pricing an outright easing cycle, or if the 2Y rolled back under 4.00% on a genuine labour-market crack.
The cross-asset tape only half-confirms the hawkish read. Equities are pressing highs: SPY at 744.78 is +1.4% WoW and +9.0% YTD, and DIA at 527.88 printed at its 52-week high, a tape that behaves as if cuts are coming rather than being denied. That is the contradiction, and we resolve it through crude and credit. Brent's -6.4% WoW slide (we flag a minor cross-source divergence of +0.5% on the Brent print, within noise) is the reconciling variable: lower energy lowers headline inflation expectations and lets equity multiples hold even as the policy rate stays put, so the melt-up is a disinflation-relief trade, not a rate-cut trade. Credit confirms the caution beneath the surface, with LQD -0.8% WoW and HYG -0.2% WoW, both drifting lower while equity indices rise, a divergence that says the fixed-income market is not endorsing the equity optimism. We are neutral US large-cap beta via SPY and would turn cautious only on a break of the QQQ trend, given QQQ fell -0.5% WoW on chip softness even as the broad index rose. The falsifier for the benign read is a widening in high yield: if HYG broke below its 52-week low of 78.72, we would read that as credit pricing the late-cycle leverage stress that the equity tape is ignoring.
Gold is the second material rail and it argues our way. GLD rose +2.3% WoW to $378.13 while remaining -5.1% YTD and well below its 52-week high of 495.90, a bid that arrived in the same week duration sold off. If this were a growth scare, gold and long bonds would rally together; instead gold rose while TLT fell -2.1%, which points to a monetary-hedge bid rather than a duration bid. The dollar corroborates: DXY at 120.89 is +0.4% WoW and +1.1% YTD near the top of its range, so gold is climbing against a firm dollar, an unusual pairing that underlines the hedge interpretation. We are neutral-to-overweight gold via GLD as a policy-error and fiat-debasement hedge over a multi-quarter horizon, accepting that it carries no yield against a 4%-plus front end.
What would change our view. On the downside for risk, a HYG break below 78.72 or a 10Y push above its 52-week high of 4.67% would force us further underweight equity beta and duration together, signalling that the long end is finally repricing the hold and dragging multiples with it. On the upside, a decisive EUR/USD recovery above 1.15 (it sits at 1.1403, oversold and -2.9% YTD) alongside Brent stabilising would tell us the dollar-funding impulse is easing and the disinflation-relief trade has room to broaden. We would also revisit the duration underweight if the 2Y fell back under 4.00% on labour data, given June payrolls at 158,984 already sit softer than the prior trend.
Source: GrowthCapital analysis; market data snapshot as of 3 July 2026; central-bank communications (FOMC, ECB) and IMF WEO (Apr 2026) for macro context.
Fixed Income
The front end is doing the repricing and the long end is lagging, which is the trade. The 2Y at 4.17% is +1.5% WoW and +20.2% YTD, sitting just under its 52-week high of 4.24%, while the 10Y at 4.48% is +1.6% WoW but only +6.9% YTD; on those two legs the 10Y-2Y gap is about 31bp. The mechanism is a policy reaction function that has anchored the near contracts: a central bank defending a 2% target holds the front end higher for longer, and the marginal buyer of two-year paper reprices before term premium adjusts. That leaves the curve bear-flattening from the short end, the signature of a hawkish hold rather than a growth scare, which would rally the front end and steepen. The incomplete pass-through matters: the 10Y has barely moved while the 2Y carried the load, so the long end still embeds cuts the policy signal does not endorse. We are underweight duration via TLT, which fell -2.1% WoW to $85.51 and is -1.7% YTD, accepting negative carry against a 4%-plus front end over one-to-two quarters in exchange for convexity if the 10Y catches down to the hold. German 10Y Bund at 2.98% (+2.8% WoW) and EM sovereigns via EMB at $96.20 (-0.4% WoW) show the same drift, a synchronised repricing of the easing timeline rather than an idiosyncratic US move. We reverse to neutral duration if the 10Y breaks its 52-week low of 3.97% or the 2Y rolls under 4.00% on a labour-market crack, either of which would flip the regime from hold to easing.
Commodities
Crude losing its war premium is the deflationary swing factor of the week. Brent at $71.59 fell -6.4% WoW while still holding +15.5% YTD, and we flag a minor cross-source divergence of +0.5% on the Brent print that sits within normal noise. The transmission runs from energy into headline inflation and then into policy space: a Strait of Hormuz shipping recovery erased the supply-shock premium, lower crude feeds directly into headline CPI expectations, and that pass-through is what lets equity multiples hold even as the Fed refuses to cut. The move is the reconciling variable between a hawkish policy signal and a rising equity tape. Gold argues a different channel entirely. GLD rose +2.3% WoW to $378.13, still -5.1% YTD and far below its 52-week high of 495.90, and it rose in the same week TLT fell -2.1%; if this were a growth scare, gold and long bonds would rally together, so the split points to a monetary-hedge bid against a firm DXY at 120.89. Natural gas at $3.33 rose +5.4% WoW and is +18.1% YTD, moving opposite crude on its own supply dynamics rather than any macro impulse. We are neutral-to-overweight gold via GLD as a policy-error and debasement hedge over a multi-quarter horizon, accepting it yields nothing against a 4%-plus front end. We hold a neutral view on crude here: our read reverses if Brent reclaims and holds above the mid-$80s, which would re-arm the supply-shock inflation thesis and force the front end even higher, or if gold broke back below its YTD-weak range on a decisive real-rate spike.
Equities
The equity tape is pressing highs into a policy signal that denies cuts, and we read the melt-up as disinflation relief rather than a rate pivot. SPY at 744.78 is +1.4% WoW and +9.0% YTD, DIA at 527.88 printed its 52-week high, and IWM at 297.58 is +19.6% YTD despite a -0.4% WoW dip. The mechanism is a valuation channel driven by the energy break: Brent's -6.4% WoW slide lowers headline inflation expectations, which caps the discount-rate pressure on equity multiples even with the policy rate held at 3.63%, so the index can rise without a rate cut. The internal leadership tells the real story. QQQ fell -0.5% WoW on semiconductor softness while the Dow and broad index rose, a rotation out of megacap growth and into cyclicals and defensives that is not the breadth profile of an all-clear risk-on tape. European equities corroborate the constructive-but-selective read, with FEZ at 68.99 up +2.1% WoW and +5.5% YTD on a softer-payroll and reform-package impulse, while EWJ at 93.14 slipped -0.3% WoW. We are neutral US large-cap beta via SPY: the disinflation-relief bid is real but the front end is not endorsing the multiple, and we would rather own the relief through gold than through beta. We turn cautious on a QQQ trend break given its OB reading near the 746.16 high, or on any credit-led widening; we turn constructive if breadth broadens and the 10Y catches down to the hold without a growth scare.
Digital Assets
Bitcoin rebounded with risk but the derivatives cohort is leaning against it, and we treat the bounce as a liquidity-impulse trade rather than a durable low. BTC at $62,007.50 rose +4.1% WoW yet is -30.2% YTD and sits near its 52-week low of 58,608, while ETH at $1,744.79 jumped +11.1% WoW, SOL at $81.48 +14.2% WoW and XRP at 1.1122 +6.3% WoW; the whole complex bounced on the softer-payroll, easing-Fed-fear reflex. The mechanism is clear: crypto here is a high-beta expression of the Fed-led liquidity impulse, so a dovish reinterpretation of the jobs print lifts the entire cohort in sympathy with the equity melt-up. But the on-chain and perps data undercut the durability of the move, with Nansen showing smart traders and whales net short across BTC, ETH and SOL on Hyperliquid even as spot rallies. BTC dominance at 55.02% and total crypto market cap of $2.26T frame a market still deeply below its YTD peak, with ETH -41.9% YTD and SOL -35.8% YTD the deepest of the majors. We are underweight the complex tactically: the spot bounce runs against the positioning of the best-informed cohort, which is the classic setup for a squeeze-then-fade rather than a trend. We turn neutral if BTC reclaims and holds well above its 52-week low with smart-money positioning flipping net long; we go further underweight if BTC breaks 58,608 on rising exchange inflows, which would confirm the cyclical liquidity impulse has rolled over.
GC Views
| Asset | View | Rationale |
|---|---|---|
| US_10Y | UW | 10Y at 4.48% still embeds cuts the hawkish hold denies; long end should catch down to the 4.17% 2Y. |
| SPY | N | SPY +9.0% YTD melt-up is disinflation relief, not a rate pivot; credit is not endorsing it. |
| BRENTOIL | N | Brent -6.4% WoW to $71.59 as Hormuz premium unwinds; neutral until a break above mid-$80s re-arms the supply shock. |
| GLD | OW | GLD +2.3% WoW while TLT fell; a monetary-hedge bid against a firm DXY, not a growth-scare bid. |
| BTC | UW | BTC +4.1% WoW spot bounce runs against net-short smart money and whales; squeeze-then-fade setup. |
| EURUSD | N | EUR/USD 1.1403, oversold and -2.9% YTD; needs a break above 1.15 to signal easing dollar-funding pressure. |
| US_2Y | N | 2Y at 4.17% correctly prices the hold near its 4.24% high; fair given the 3.63% policy rate. |
| TLT | UW | TLT -2.1% WoW; underweight duration into a long end that has not caught down to the hawkish hold. |
| DE_10Y | N | Bund 2.98% (+2.8% WoW) reprices ECB easing odds; balanced as oil relief offsets sticky core. |
| QQQ | N | QQQ -0.5% WoW on chip softness, OB near its 746.16 high; watch for a trend break. |
| IWM | N | IWM +19.6% YTD leads on the disinflation bid but -0.4% WoW; constructive only on broadening breadth. |
| ETH | UW | ETH +11.1% WoW spot bounce but -41.9% YTD and whales net short; high-beta liquidity trade only. |
| SOL | UW | SOL +14.2% WoW yet -35.8% YTD with exchange inflows; bounce runs against net-short cohorts. |
On-Chain Pulse
The aggregate on-chain picture is a spot rally that the best-informed cohorts are fading. Across Hyperliquid perps, Nansen shows smart traders and whales predominantly net short on BTC, ETH and SOL even as the spot complex jumped on the softer-payroll, easing-Fed reflex. That divergence between a rising tape and net-short professional positioning is the defining pattern of the week, and it argues for treating the bounce as a squeeze rather than a trend.
Bitcoin is the clearest example of the tension. On the derivatives side, Nansen tags smart traders net short $35.2M against $98M of total exposure, and whales net short $72.7M against a far larger $1.9B total book, so the whale short is a small tilt on an enormous position rather than an all-in bet. Yet on-chain flows lean the other way: WBTC-proxy exchange flow shows a net outflow of -$5.7M, an accumulation signal, alongside public-figure net inflows of +$9.6M and fresh-wallet inflows of +$9.4M. The spot-versus-perps split is the whole story here, with quiet spot accumulation running against a net-short perps book. BTC spot at $62,007.50 is +4.1% WoW but still near its 52-week low of 58,608, and dominance at 55.02% shows capital is not yet rotating aggressively down the risk curve. We are underweight tactically: the perps positioning of the informed cohort argues the path of least resistance is a fade unless spot accumulation forces the shorts to cover.
Ethereum shows the sharpest spot strength of the majors and the intel supports treating it as the highest-beta expression of the liquidity impulse. ETH spot at $1,744.79 ripped +11.1% WoW, the largest weekly move in the complex, yet it remains -41.9% YTD, the deepest drawdown among the majors and far below its 52-week high of 4,157.33. Nansen flags massive exchange outflows on ETH, a constructive on-chain signal that contrasts with the broadly net-short perps lean across the cohort. That outflow-versus-short divergence mirrors the BTC setup: spot holders are accumulating while derivatives desks stay defensive. The scale of the YTD drawdown means any short-covering squeeze has room to run further on ETH than on BTC. We hold ETH underweight given the net-short professional lean, but we flag it as the asset most exposed to an upside squeeze if the exchange outflows continue.
Solana is where the on-chain signal turns outright cautious. SOL spot at $81.48 led the weekly bounce at +14.2% WoW, but it sits -35.8% YTD and well below its 52-week high of 200.04, so the rally is a low-quality retracement off deeply depressed levels. Unlike ETH, Nansen shows SOL with significant exchange inflows, a bearish signal that suggests holders are moving coins onto venues to sell into the strength rather than accumulating. Combined with the net-short lean in the smart-trader and whale perps cohorts, that inflow pattern makes SOL the weakest risk-reward in the complex. The spot-versus-flow divergence is negative here, the opposite of ETH. We are underweight SOL and would treat any further spike as a distribution opportunity for holders rather than the start of a trend, pending a reversal in the exchange-flow direction.
Frontier Watch
The frontier signal this week is in sovereign capital deployment rather than pre-IPO listings, and it corroborates our monetary-hedge and real-asset lean. Global SWF data shows Gulf sovereign funds committing a record $53.9B across 108 deals in the first half of 2026, a pace that continued through the week despite the earlier war uncertainty. Mubadala led group activity at $15.2B and this week tabled a $1.1B bid for Pierre & Vacances-Center Parcs, a real-asset and consumer-resort target that fits a capital-preservation-plus-cashflow mandate. QIA closed into the $7.4B Janus Henderson take-private alongside Trian and General Catalyst, taking a stake in an active asset manager rather than a passive index vehicle. Norges is finalising a roughly €1.5B purchase of nine Spanish shopping centres, and Temasek is trimming a $200M Policybazaar stake, a rotation from a fintech growth position into hard-asset retail exposure. The common thread across these deployments is a preference for real assets and cashflow-generative operating businesses over duration and beta, which is the same instinct behind our overweight gold and underweight long-duration stance. We read persistent sovereign real-asset deployment at this scale as a signal that the largest patient-capital allocators are positioning for a higher-for-longer rate path and a fiat-debasement risk, not a return to the pre-shock easing cycle. This is context, not a tradable snapshot signal, and none of these deal figures enter our positioning views directly.
What We're Watching
The reconciling levels sit in rates and credit. If the 10Y breaks above its 52-week high of 4.67%, we go further underweight equity beta and duration together: that would signal the long end is finally repricing the hold. If HYG breaks below its 52-week low of 78.72, we read credit as pricing the late-cycle leverage stress the equity tape is ignoring. On the upside, a EUR/USD recovery above 1.15 (from 1.1403) with Brent stabilising would tell us dollar-funding pressure is easing and the disinflation-relief trade can broaden. We revisit the duration underweight if the 2Y falls under 4.00% on a labour crack, given June payrolls at 158,984 already print softer.
This Week in Charts