The Fed's hawkish hold has moved the repricing to the long end. The 10Y sits at 4.67%, 4bp below its 4.71% 52-week high, while TLT closed the week at a fresh 52-week low of $82.41, -5.3% YTD.
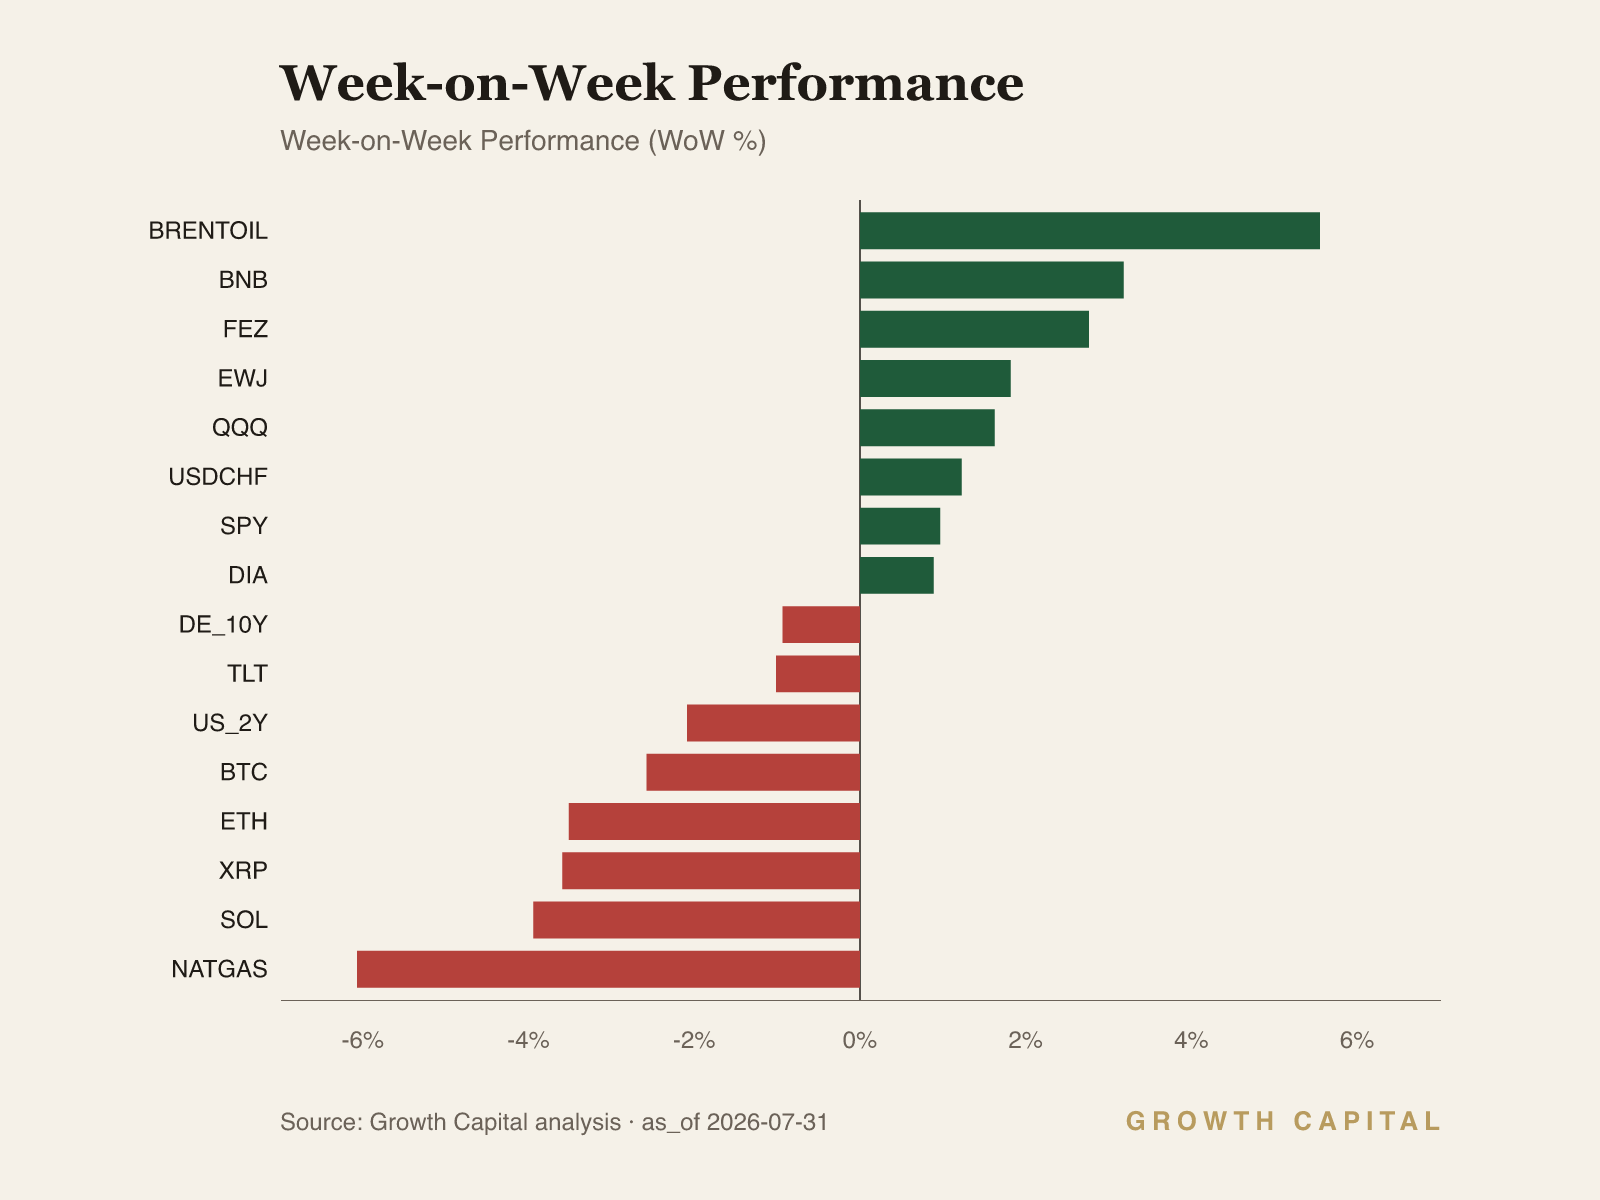
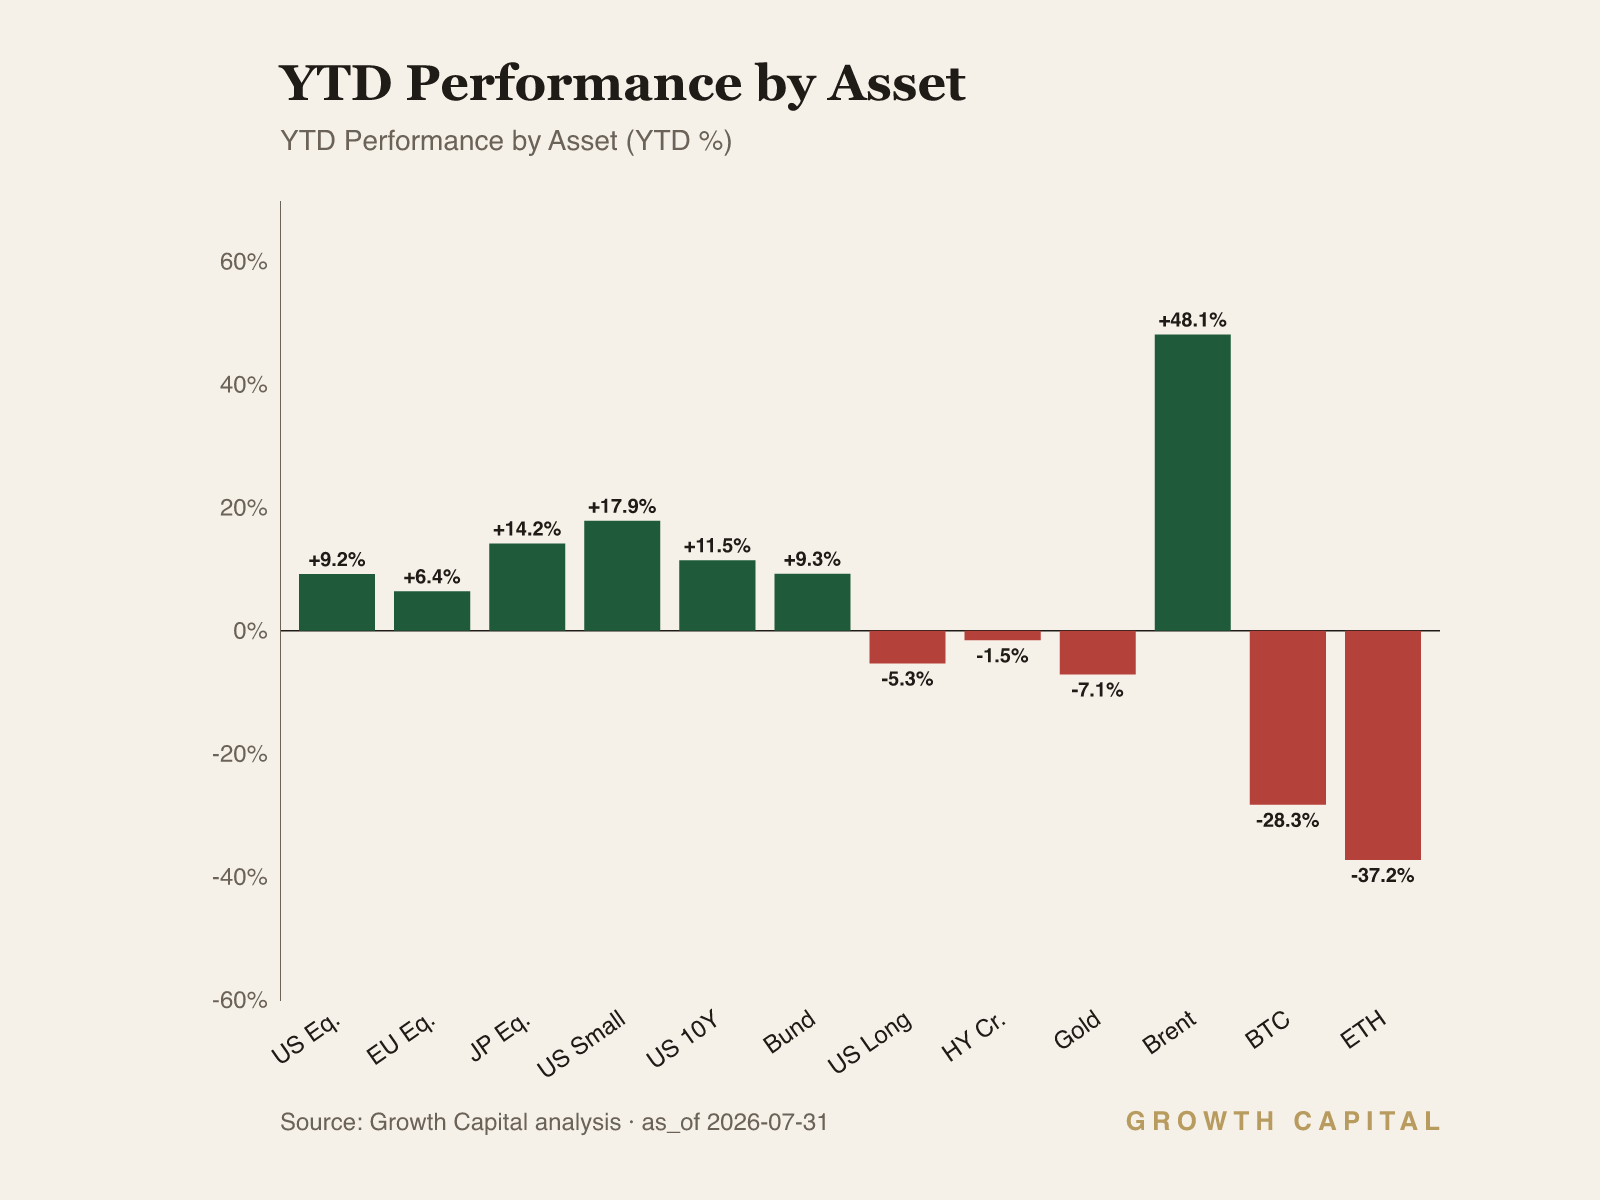
Equities and credit disagree, and we side with credit. SPY gained +1.0% WoW to $746.08, +9.2% YTD, while LQD at $106.30 is -3.5% YTD and seven cents above its 52-week low; the 12.7-point gap is the widest cross-asset disagreement on our board.
Dollar strength is the pressure valve on everything else. DXY at 120.71 sits 1% below its 121.92 high, USD/JPY at 163.71 is within 0.1% of its 163.80 peak, and GLD is -7.1% YTD in a confirmed downtrend.
Our positioning: The Fed's hawkish hold has shifted the repricing to the long end; we hold duration underweight until the 10Y decisively rejects its 4.71% high.
The long end, not the funds rate, now sets the price of risk
The week's regime is a hawkish hold with a bear-steepening tail. The Federal Reserve left policy unchanged at an effective funds rate of 3.63%, with a dissenting minority on record for an immediate hike, and the European Central Bank held a week earlier. The bond market's response settled the argument about where risk now lives: the US 10Y closed at 4.67%, flat WoW and 4bp from its 4.71% 52-week high, while TLT printed a new 52-week low at $82.41. Equities absorbed the message without flinching, SPY adding +1.0% WoW to $746.08. Growth data gave the hold cover, with unemployment at 4.2% and the advance GDP print at 1.5%. Our thesis for the week is singular: the funds rate has stopped doing the work, the long end is setting the price of risk, and every cross-asset position should be tested against a 4.67% 10Y. On that test we are underweight long duration and neutral equities.
Start with the curve. The 10Y held at 4.67% on the week while the 2Y eased -2.1% WoW to 4.22%, leaving a 45bp gap between the 10Y at 4.67% and the 2Y at 4.22%, and the 10Y's slightly overbought, uptrending profile says the pressure is not exhausted. TLT's -1.0% WoW fall to its $82.41 52-week low, -5.3% YTD, is the duration expression of the same print. The transmission channel runs from policy credibility into term premium into duration. A hold delivered alongside dissents for a hike, while an energy shock keeps the inflation path uncertain, tells the market the committee will not pre-commit the front end, so the residual inflation risk migrates out the curve and gets priced as term premium rather than as future hikes. The year-to-date pattern quantifies the migration: the 2Y has repriced +21.6% YTD in yield terms against +11.5% for the 10Y, so the front end did the early work and the long end is now absorbing the remainder. Duration then passes into everything priced off it, with LQD, the most duration-heavy credit proxy on our board, down -3.5% YTD. Our positioning follows the channel: underweight long duration through TLT on a six-to-twelve-month horizon, overweight the front end where a 4.22% 2Y pays the wait and the hold sets a high bar to further hikes. The trade-off we accept is convexity, since a growth accident from here would reward exactly the duration we decline to own. A weekly 10Y close above the 4.71% 52-week high would confirm uncontained term-premium expansion and push us deeper underweight. A retreat below 4.37%, the level of the 2Y's own 52-week high, would signal the market re-pricing the policy path down rather than the premium up, and we would close the TLT underweight.
Equities spent the week contradicting that regime read. SPY rose +1.0% WoW to $746.08, +9.2% YTD and 1.8% below its $759.57 high; QQQ gained +1.6% WoW to $695.35, +13.4% YTD; IWM leads the board at +17.9% YTD. Credit sits on the other side of the argument: LQD closed at $106.30, seven cents above its $106.22 52-week low, and HYG at $79.42 is -1.5% YTD, both slightly oversold. The two tapes share a discount rate but not an earnings stream, and that difference is the whole reconciliation. The rates-to-duration-to-multiples channel argues equities should de-rate with the 10Y at 4.67%; the index resisted because a narrow set of AI-linked earnings, anchored by a large cloud beat this reporting week, supplied cash-flow growth big enough to absorb the discount-rate drag at the index level while breadth stayed thin. Credit has no such offset: investment-grade total return is dominated by the rate leg, so LQD's -3.5% YTD is largely the Treasury move restated, while high yield's shallower -1.5% YTD says spreads themselves remain calm. The equity tape therefore contradicts the P1 regime and credit confirms it; the 12.7-point gap between SPY at +9.2% YTD and LQD at -3.5% YTD is the widest disagreement on our board, and we resolve it in credit's favor. We hold equities at neutral, tilted to quality and away from long-duration growth beta, over a Q3 horizon, and we accept underperformance risk if concentrated AI earnings keep carrying the index. An HYG break below its 78.72 52-week low would mark stress migrating from the rate leg to the spread leg and would cut our equity stance to underweight; an SPY close above $759.57 with IWM confirming above $300.45 would evidence breadth repair and lift us to overweight.
The dollar is the rail that ties the regime together. DXY at 120.71, +0.1% WoW and +0.9% YTD, sits 1% below its 121.92 52-week high; USD/JPY at 163.71 is within 0.1% of its 163.80 peak; EUR/USD at 1.1385 is slightly oversold, 0.3% above its 1.1348 low. The channel runs from rate differentials through the exchange rate into import prices: a Fed holding at an effective 3.63% against materially easier European and Japanese settings keeps capital in dollars. The energy shock compounds it, with Brent at $91.82/bbl and +48.1% YTD on our primary feed, a print we caveat because our crosscheck source diverges by -3.7%, pushing imported inflation onto energy importers precisely when their central banks want to stay on hold. Gold confirms the dollar's gravity, GLD at -7.1% YTD in a downtrend despite the geopolitical tape, and BTC at $63,683, -28.3% YTD, sits at the liquidity-sensitive end of the same chain. Cross-asset coherence with the regime is high: everything long duration or short dollars is losing.
The falsifiers are specific. Downside: a weekly 10Y close above 4.71% combined with HYG below 78.72 would mark the shift from an orderly term-premium repricing to a spread event, and we would cut equities to underweight and add front-end quality. A DXY break of 121.92 or USD/JPY through 163.80 would flag disorderly dollar demand and raise the odds of official intervention, the same signal in a different market. Upside: an SPY close above $759.57 with IWM above $300.45 and LQD stabilising above its $106.22 low would tell us risk assets can carry a 4.67% 10Y, and we would add equity beta. A 10Y retreat below 4.37% would invert the duration call entirely. We publish these levels so the next move in our views is legible in advance.
Source: GrowthCapital analysis; GC weekly market snapshot (exchange ETF proxies and FRED series); Federal Reserve FOMC statement, 29 July 2026; ECB Governing Council statement, 23 July 2026.
Fixed Income
The Treasury market delivered the week's defining print: a 10Y at 4.67%, unchanged WoW, slightly overbought, and 4bp below its 4.71% 52-week high, while the 2Y eased -2.1% WoW to 4.22%. The gap between the 10Y at 4.67% and the 2Y at 4.22% is 45bp, and the composition of the move matters more than the level: the 2Y has repriced +21.6% YTD against +11.5% for the 10Y, so the front end led early and the long end is now absorbing the residual. The mechanism is a policy hold that transfers inflation risk out the curve. With dissents on record for a hike and an energy shock still feeding the price level, the committee declined to pre-commit; the market responded by charging more term premium rather than pricing more hikes, and duration proxies took the hit, TLT falling -1.0% WoW to a $82.41 52-week low, -5.3% YTD. Credit restates the same rate move: LQD at $106.30 is -3.5% YTD, seven cents above its $106.22 low, while HYG at $79.42 is only -1.5% YTD, which tells us the spread leg remains calm even as the rate leg bleeds. We are underweight TLT and LQD, overweight the front end where a 4.22% 2Y pays the wait, and neutral high yield. A 10Y close above 4.71% deepens the underweight; a retreat below 4.37%, or an HYG break of its 78.72 low, would each force a re-draw of the whole complex.
Equities
Equities rallied into the rate repricing rather than away from it. SPY added +1.0% WoW to $746.08, +9.2% YTD and 1.8% below its $759.57 high; QQQ gained +1.6% WoW to $695.35, +13.4% YTD and 6.8% under its $746.16 peak; IWM leads the board at +17.9% YTD; FEZ was the week's best developed-market proxy at +2.8% WoW to $69.56. The mechanism holding this together is earnings concentration. A narrow set of AI-linked results, anchored by a large cloud beat this reporting week, supplied enough cash-flow growth to offset the discount-rate drag from a 4.67% 10Y at the index level, while breadth beneath the surface stayed thin. The cross-asset ledger prices that fragility: SPY at +9.2% YTD against LQD at -3.5% YTD is a 12.7-point disagreement between two claims on the same corporate balance sheets, and the difference is entirely the earnings stream equities own and credit does not. A higher risk-free rate with a concentrated earnings offset argues for a compressed reward for bearing index risk, so we hold equities at neutral, tilted to quality and away from long-duration growth beta, on a Q3 horizon. We accept underperformance risk if AI earnings keep carrying the index. An SPY close above $759.57 with IWM through $300.45 would evidence breadth repair and move us to overweight; an HYG break below 78.72 would cut us to underweight regardless of the equity tape, because credit stress precedes equity stress in this regime.
Forex
The dollar is within 1% of a 52-week high on the broad index, and the crosses agree with the rates story. DXY at 120.71 added +0.1% WoW and is +0.9% YTD against a 121.92 high; USD/JPY at 163.71 sits within 0.1% of its 163.80 peak; EUR/USD at 1.1385 is slightly oversold and only 0.3% above its 1.1348 52-week low; USD/CHF at 0.8168 presses its 0.8172 high. The channel is rate differentials into the exchange rate into import prices. A Federal Reserve holding at an effective 3.63% with dissents for a hike, against far easier European and Japanese settings, keeps the carry and the capital flow in dollars; the strong dollar then exports inflation to energy-importing economies exactly when their central banks want to hold, which limits their ability to close the differential and reinforces the loop. The yen is the stress point: at 0.1% from the high, the pair trades where official intervention risk is the dominant short-term variable, and we will not be short yen into that. We are overweight the dollar, underweight EUR/USD on the unresolved policy divergence, and neutral USD/JPY on intervention risk. A DXY break of 121.92 would signal disorderly dollar demand and funding stress rather than benign carry, and would push us defensive across risk assets; EUR/USD holding 1.1348 and turning higher would be the first evidence the divergence is fully priced, and we would close the euro underweight.
Digital Assets
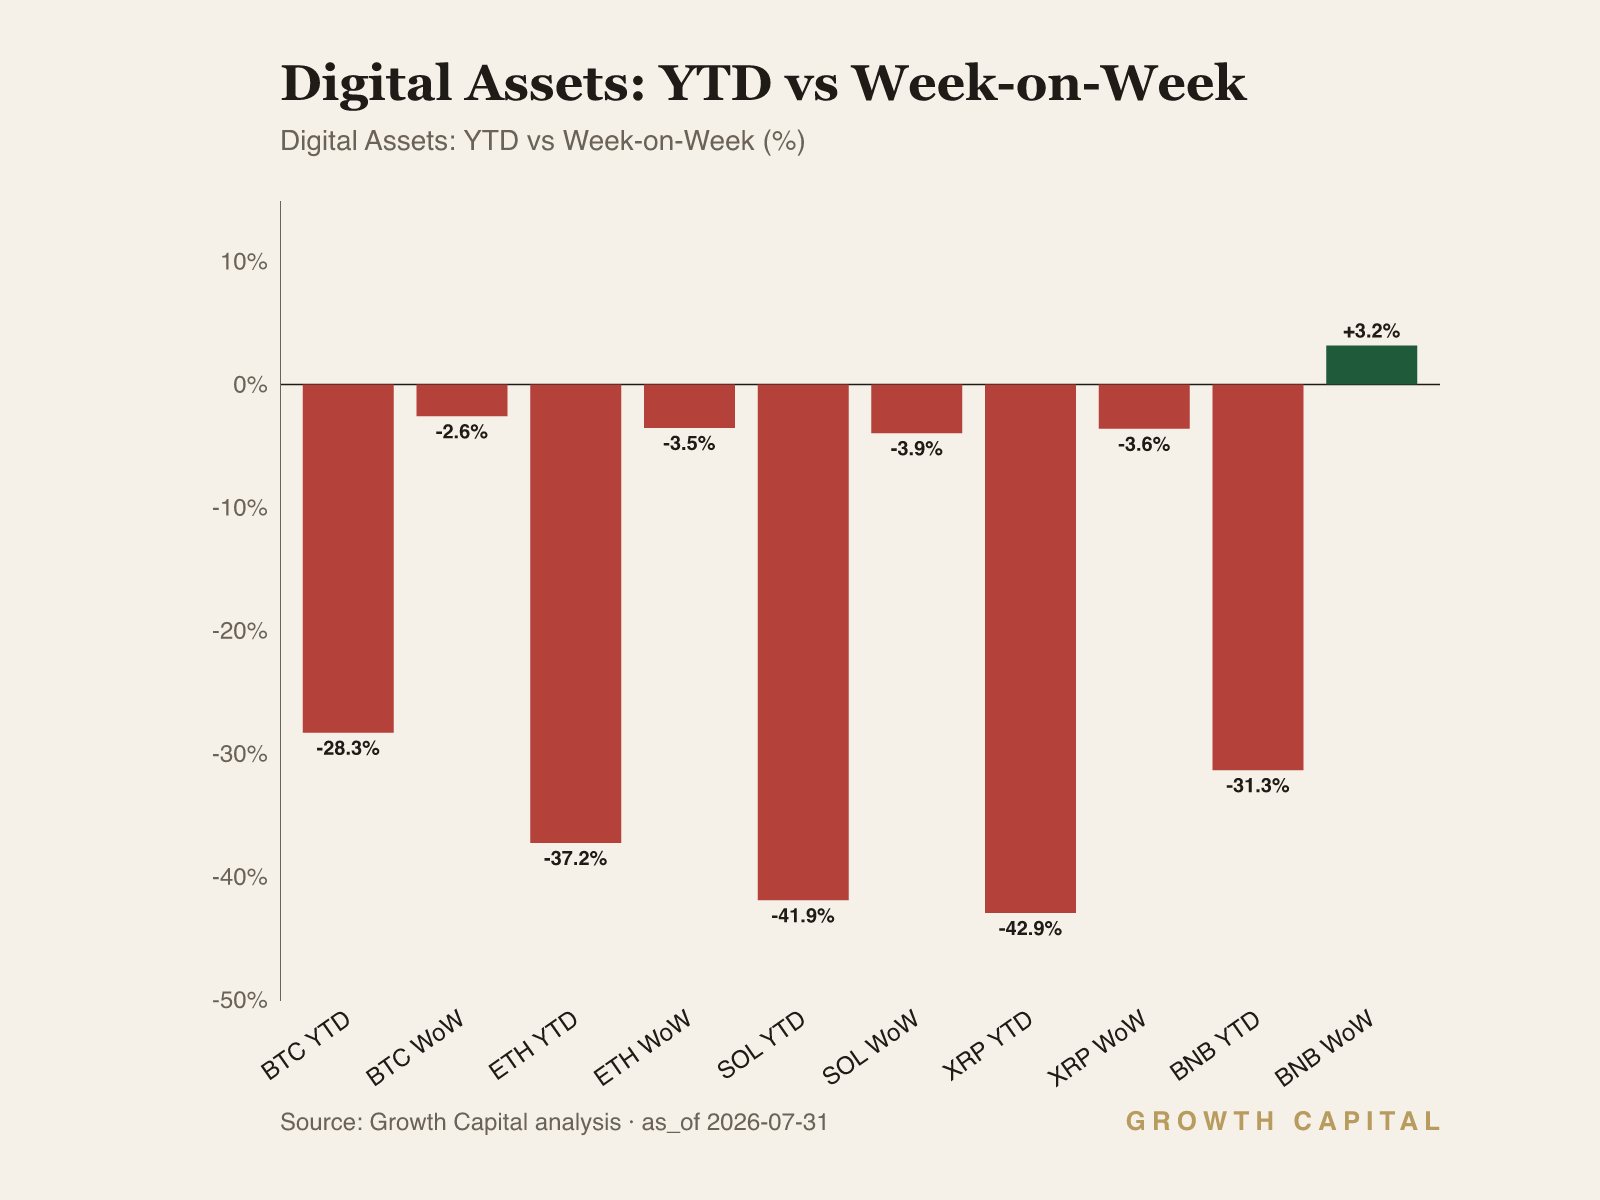
Digital assets remain the liquidity-sensitive end of the duration regime. BTC fell -2.6% WoW to $63,683, -28.3% YTD and 8.7% above its 58,608.4 52-week low; ETH lost -3.5% WoW to $1,885.15, -37.2% YTD; SOL declined -3.9% WoW to $73.70, -41.9% YTD. BTC dominance at 56.0%, total capitalisation at $2.28T and 24-hour volume of $308.2B describe a market consolidating into its largest asset, the defensive rotation within the class. The mechanism is the same one pricing TLT: assets whose value rests on future adoption are long-duration claims, and a 10Y at 4.67% with an expanding term premium raises their discount rate with no earnings offset, while a dollar 1% from its 52-week high tightens the global liquidity that drives marginal crypto flows. Our on-chain work, detailed in the pulse below, shows spot exchange outflows across the majors set against net-short perpetual books in every tracked cohort, hedged accumulation rather than conviction buying. We are underweight BTC and SOL and neutral ETH, where the exchange-outflow base is the strongest of the group and the entry versus a $1,566.93 52-week low is the most favorable on the board. A BTC break of 58,608.4 opens a deleveraging leg and widens the underweight across the class; a smart-money flip to net-long perps alongside continued spot outflows is the specific combination that would move us back toward the asset class, because it would show the informed cohorts removing their hedges rather than adding to them.
GC Views
| Asset | View | Rationale |
|---|---|---|
| US_10Y | UW | 4.67%, 4bp off the 4.71% high with hike dissents on record; term-premium risk is unresolved. |
| US_2Y | OW | 4.22% pays the wait; the hold sets a high bar to further hikes after a +21.6% YTD repricing. |
| TLT | UW | At its 52-week low of $82.41, -5.3% YTD; no support until the policy path re-prices below 4.37%. |
| LQD | UW | -3.5% YTD, seven cents above the $106.22 low; duration-heavy IG carries the rate leg with no cushion. |
| HYG | N | -1.5% YTD holding above 78.72; spreads are calm, and that level is our falsifier. |
| SPY | N | +9.2% YTD on narrow AI leadership against a 4.67% 10Y; hold, do not add beta. |
| QQQ | N | +13.4% YTD, 6.8% off the $746.16 high; earnings carry offsets the discount-rate drag for now. |
| DXY | OW | 120.71, within 1% of the 121.92 high; policy divergence and the energy shock both pay the dollar. |
| USDJPY | N | 163.71 against a 163.80 high; intervention risk truncates the carry from here. |
| EURUSD | UW | Slightly oversold at 1.1385 but only 0.3% above the 1.1348 low; the divergence is unresolved. |
| BTC | UW | -28.3% YTD with whale perp books net short $24M on-chain; the liquidity regime is against it. |
| GLD | UW | -7.1% YTD in a downtrend against a 120.71 dollar; the dollar channel dominates the geopolitics. |
On-Chain Pulse
The cross-asset on-chain pattern this week is uniform: spot exchange outflows across the majors, a supply-tightening signal, set against net-short perpetual books in every tracked cohort on Hyperliquid. That combination reads as hedged accumulation, wallets pulling coins off exchanges while paying for downside protection into a soft tape. We treat it as defensive positioning, not a bottom signal.
Bitcoin's spot ledger leans constructive. Exchange flows printed a net outflow of $12.1M at 1.6x the weekly average, funds and top-PnL wallets added a net $15.2M across 31 wallets, and fresh wallets absorbed a further $15.8M. The derivatives book says the opposite. Whales are net short $24M on Hyperliquid, $920.4M long against $944.3M short on a $1.9B gross book, a net tilt of just over 1% of total exposure; smart traders are net short $53.1M with $11.7M long against $64.8M short, a book roughly 25x smaller than the whale book in gross terms but far more directional at about 85% short by exposure. Public figures add a further $20.5M net short. The $1.9B whale gross book anchors open interest for the pair. Our positioning implication: stay underweight BTC at $63,683; when the most directional cohort, smart traders at roughly 85% short, flips net long, we revisit the stance.
Ethereum carries the strongest spot signal of the group and the messiest cohort split. Exchange net outflows reached $543.4M at 1.3x average, the largest supply withdrawal of the majors; top-PnL wallets bought a net $42.5M across 106 wallets and fresh wallets took in $303.4M. Smart traders, however, distributed $26.2M in spot at 5.3x their average across 281 wallets, a direct divergence from the top-PnL cohort's accumulation. On perps, whales are net short $21.2M, $808.7M long against $829.9M short on a $1.64B gross book, a 1.3% net tilt, while smart traders run net short $6.9M and public figures net short $19.8M. The $1.64B whale gross book frames open interest for the pair. GC implication: neutral. The exchange-outflow base is real, and at $1,885.15 against a $1,566.93 52-week low the entry is the best of the majors, but we want the smart-trader spot distribution to stop before adding.
Solana is the only major where every informed cohort sold spot simultaneously. Whales distributed a net $2.9M, public figures $1.9M at 4.7x their average, and smart traders $672.6k at 2.9x average, while exchange outflows of $23.3M ran at only 0.7x the weekly norm, below-trend accumulation at best. Top-PnL buying was token at +$988.5k across just 38 wallets, and the +$864.2M fresh-wallet inflow flatters a tape the informed cohorts are leaving. The Hyperliquid whale derivatives print for SOL was incomplete this week, so we carry no funding or open-interest anchor and flag the gap rather than estimate around it. On the spot evidence alone the cohort alignment is the weakest on the board. Implication: underweight; at $73.70 and -41.9% YTD, we would reconsider only on a clean perp print showing whales net long alongside above-average exchange outflows.
What We're Watching
Five levels govern our next moves. A weekly 10Y close above 4.71% deepens the duration underweight and puts the equity neutral under review; a retreat below 4.37% closes the TLT underweight entirely. HYG below its 78.72 52-week low signals spread stress and cuts equities to underweight regardless of the index tape. SPY above $759.57 with IWM confirming above $300.45 evidences breadth repair and lifts equities to overweight. DXY through 121.92 or USD/JPY through 163.80 flags disorderly dollar demand and likely official intervention, and we would turn defensive across risk assets. BTC below its 58,608.4 52-week low opens a deleveraging leg, and we would widen the digital-asset underweight.
This Week in Charts