The long end is doing the tightening. The 10Y at 4.68% sits 7bp from its 4.75% 52-week high while the policy rate holds at an effective 3.63%; we are underweight long duration and take carry at the 2Y's 4.2%.
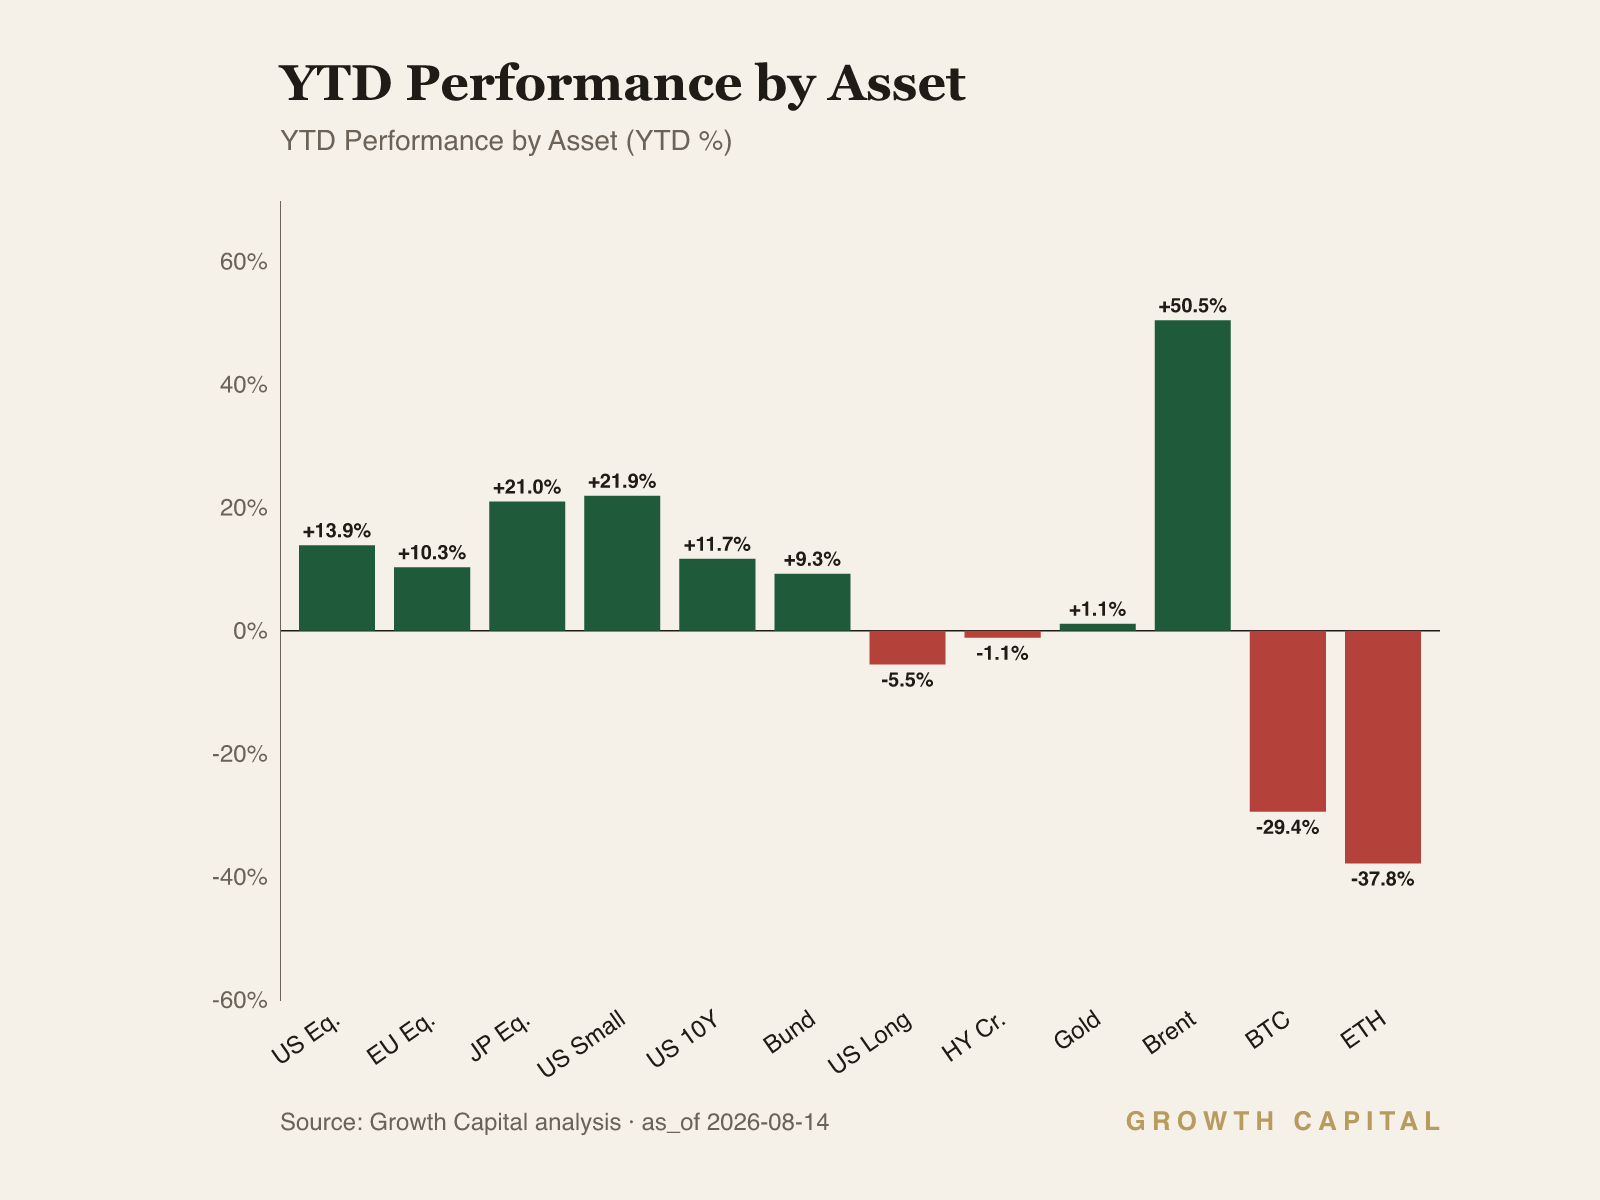
Equities and credit disagree, and credit is the cleaner read. SPY's fresh 52-week high at 778.12 (+13.9% YTD) stands against LQD at -3.4% YTD just above its 105.96 52-week low; earnings must keep funding a 17.3-point gap.
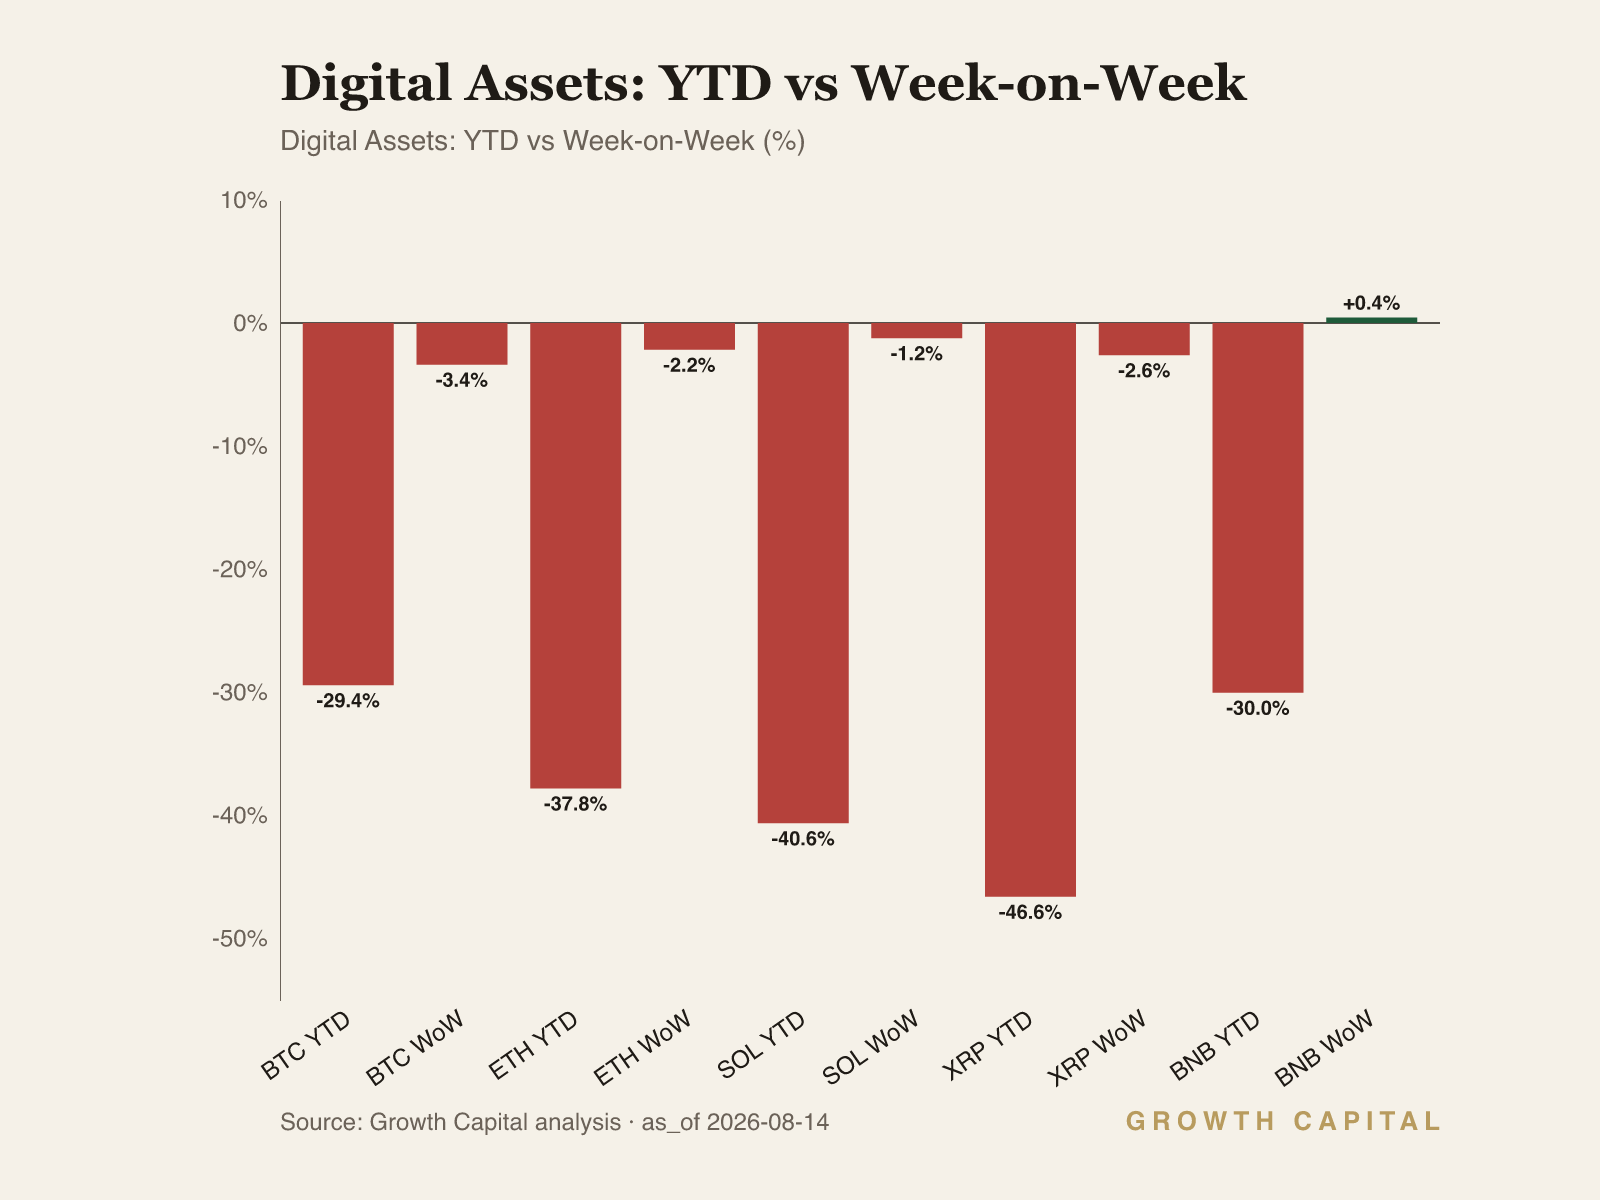
Crypto flows point lower, with one exception. BTC fell -3.4% WoW to $62,670.8 with Hyperliquid whales net short $27.1M, while ETH drew a $12M smart-money inflow, $276M of exchange outflows and a $57.2M whale long.
Our positioning: The 10Y at 4.68% is repricing term premium, not growth; we stay underweight long duration and neutral equity beta.
Term premium does the tightening while the equity multiple ignores it
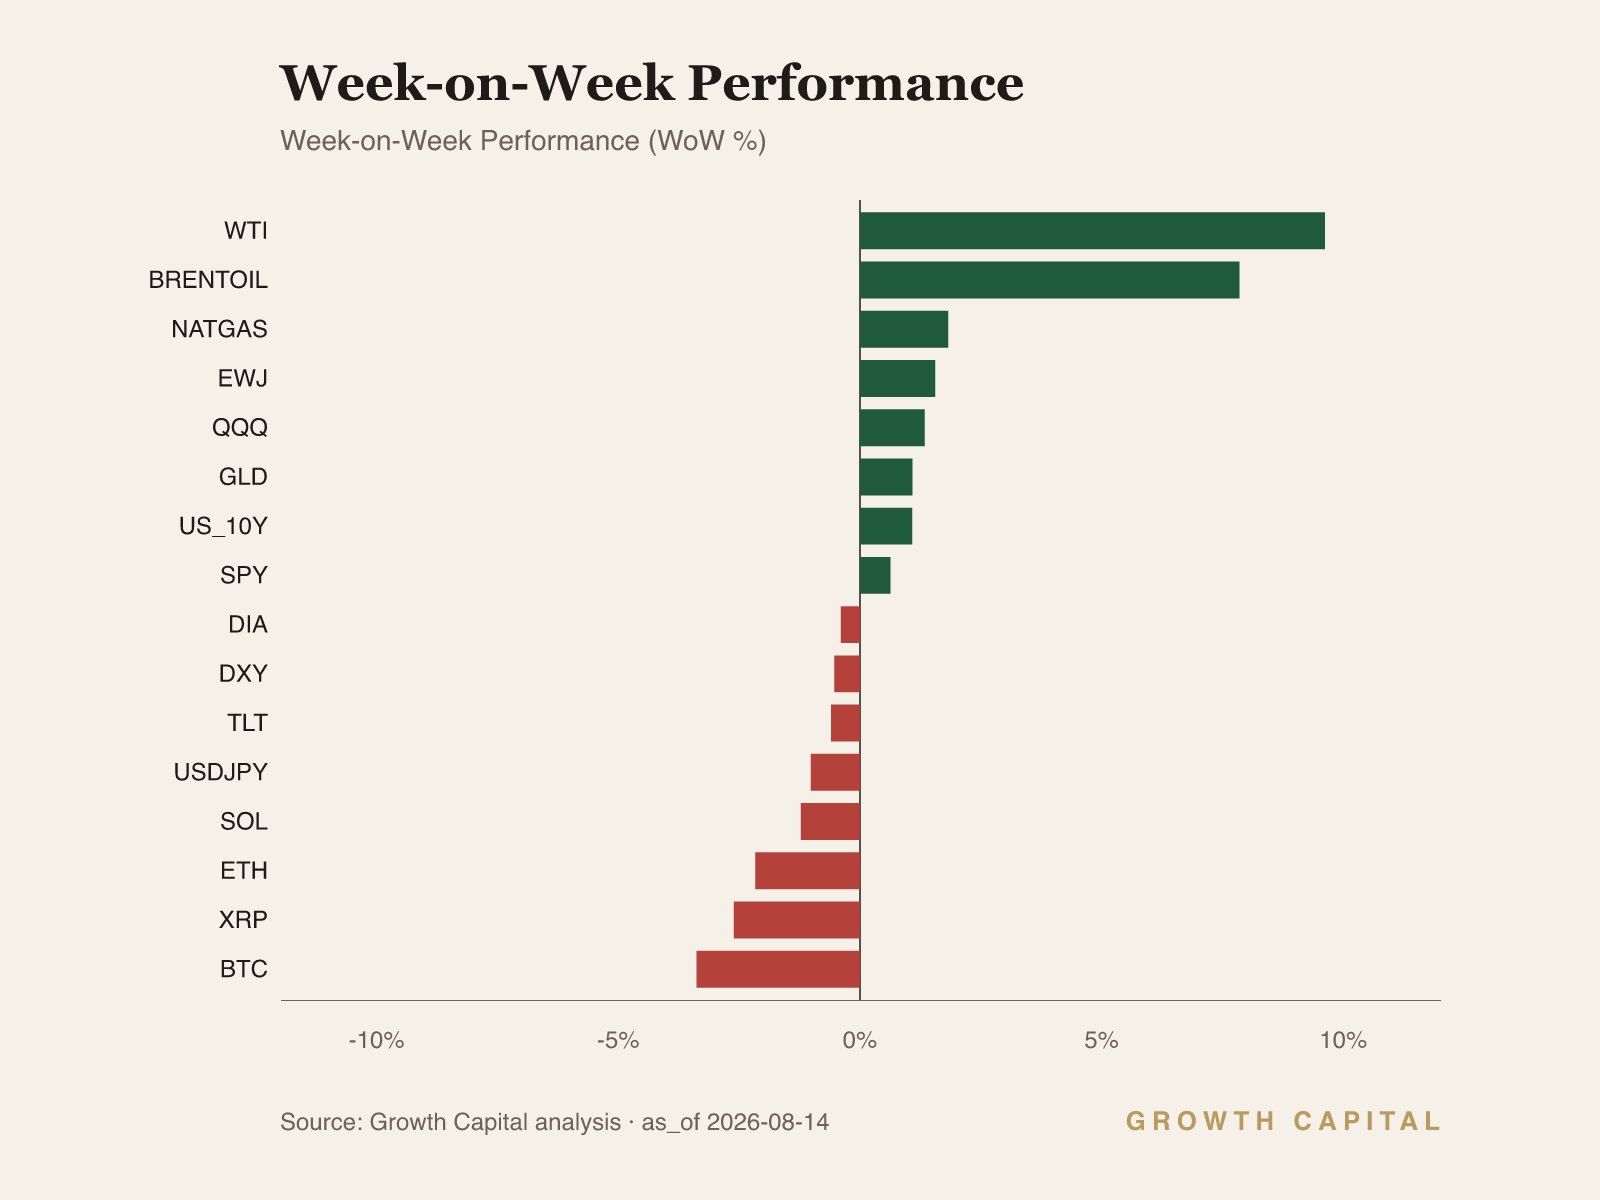
The week's regime is a hawkish hold with a stagflation lean: policy sits at an effective 3.63% fed funds rate after a contested decision to stay on hold, while the 10Y Treasury climbs to 4.68%, within 7bp of its 4.75% 52-week high. Equities refuse to blink, with SPY printing a fresh 52-week high at 778.12 (+0.6% WoW, +13.9% YTD). Three policymakers dissented in favor of tighter policy, and the energy tape argues their side. The long end is doing the tightening the policy rate is not. That combination, a stable front end, a rising long end and record equity prices, is internally unstable; one leg has to give. Our house read is that the bond market is the honest broker this week and the equity multiple is the exposed variable. We hold that view with defined falsifiers, set out below.
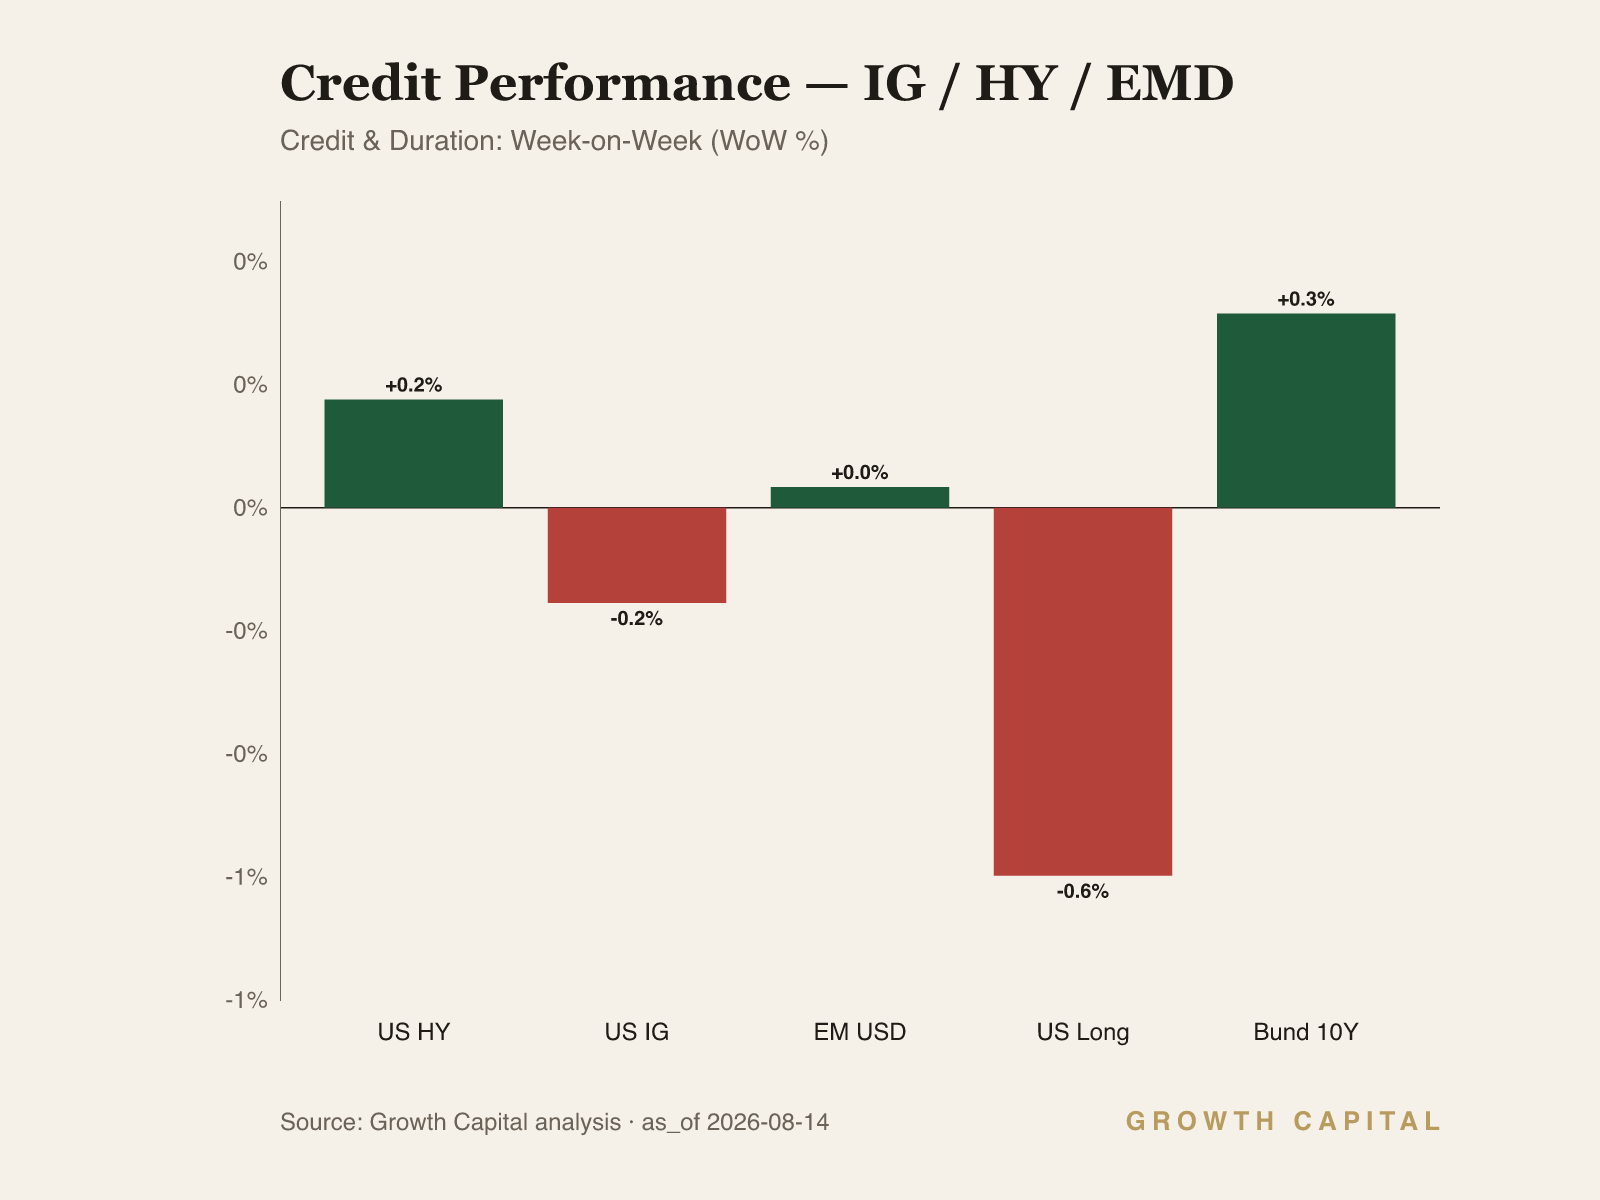
The 10Y Treasury yield sits at 4.68%, +1.1% WoW and 7bp below its 4.75% 52-week high, while the 2Y at 4.2% rose only +0.5% WoW, which leaves a 48bp gap between the 10Y at 4.68% and the 2Y at 4.2%. The move has company: the German 10Y Bund at 3.18% is pressing its own 3.22% 52-week high, and TLT closed at 82.26, just above its 82.06 52-week low and flagged slightly oversold. The transmission runs rates to duration to multiples, and this week the first link is term premium. With the policy rate parked at 3.63% and the front end barely moving, the selloff is concentrated in maturities the policy path does not control, which means investors are demanding more compensation for inflation and supply risk, not pricing more hikes. Energy strength loads the inflation leg and heavy bill issuance loads the supply leg, and each increment of term premium passes one-for-one into the discount rate on long-duration cash flows. The pass-through is visible in the instruments: TLT is -5.5% YTD while SPY is +13.9% YTD, so the bond leg has paid the toll the equity multiple has so far refused. We are underweight long duration on a one-to-two-quarter horizon and take fixed income carry at the front end, where the 2Y pays 4.2% against a 3.63% policy rate. The trade-off we accept is forgone convexity: in an abrupt growth break, long bonds rally hardest and we will lag. A decisive close above the 4.75% 52-week high alongside an equity drawdown inverts the call, because overshoot converts the risk we avoid into the entry we want. A 2Y slide toward its 3.38% 52-week low would invert it from the other side, since that print would say the market is pricing policy relief rather than inflation persistence.
SPY at 778.12 printed a 52-week high (+0.6% WoW, +13.9% YTD), QQQ added +1.3% WoW to 732.73 (+19.5% YTD), and IWM's +21.9% YTD has small caps at their 303.50 peak, so the equity tape reads pure risk-on. Credit reads the opposite: LQD at 106.39 is -3.4% YTD just above its 105.96 52-week low, and HYG is -1.1% YTD, so the two markets that share a discount rate disagree about it. The reconciliation is that investment-grade credit is the cleaner duration instrument. LQD carries the rate shock straight through price with minimal spread cushion, HYG's larger coupon absorbs more of it, and equity is being carried by an earnings channel, AI-linked capex and semiconductor results, that currently outruns the discount-rate channel entirely. The residual is measurable: a 17.3-point YTD gap between SPY at +13.9% and LQD at -3.4%, which earnings growth must keep funding every week the 10Y stays near 4.68%. So the equity tape contradicts the P1 regime on the surface but survives on earnings, not on a different rates view. We hold equities at neutral with a quality tilt across slightly overbought proxies, and accept underparticipation if the advance extends. HYG through its 78.72 52-week low flips us, because it would signal the move from duration repricing to default repricing; at that print we cut equities to underweight regardless of the earnings tape.
Energy is the second rail this week and it feeds the inflation tail directly. Brent rose +7.9% WoW and is +50.5% YTD, though our primary feed prints $93.26/bbl against a crosscheck at $84.96/bbl, an 8.9% divergence, so we treat the direction as the signal and the level as unreliable; WTI shows the same pattern at +9.6% WoW with an equivalent gap ($84.77 primary, $80.15 crosscheck). The dollar removes one excuse: DXY fell -0.5% WoW to 119.06, so crude strength is not an FX artifact and passes straight into inflation expectations. Gold agrees at the margin, with GLD +1.1% WoW to $402.80 yet only +1.1% YTD and well below its $495.90 52-week high, insurance still cheap by its own range. Natural gas at $2.79/MMBtu (-1.1% YTD) says the shock is crude-specific rather than broad energy. The commodity tape is therefore coherent with the regime: it is the reason the long end will not rally, and it keeps the risk-on equity tape on borrowed time.
Our falsifiers are explicit. Downside: a 10Y close above 4.75% combined with LQD below its 105.96 52-week low would signal the move from repricing to stress, and we would cut equities to underweight while adding the long duration we currently avoid at better levels. Upside: a crude reversal alongside a 10Y retreat from 4.68% with SPY holding near 778 would say the inflation tail is deflating, and we would lift duration to neutral and add equity beta. In crypto, BTC losing its $58,608.4 52-week low confirms the distribution our on-chain work flags, while two weeks of positive spot ETF flows would neutralize the underweight instead. In FX, USDJPY pressing back toward its 163.86 52-week high re-opens intervention risk and argues for trimming EWJ despite its +21.0% YTD run. Until one of these prints, the book stays short duration, long the front end, neutral equities and light crypto.
Source: GrowthCapital analysis; market data per GC snapshot of 14 August 2026; on-chain data per Nansen and Hyperliquid.
Fixed Income
The long end is the week's thesis. The 10Y at 4.68% (+1.1% WoW) sits 7bp under its 4.75% 52-week high, while the 2Y at 4.2% (+0.5% WoW) barely moved, so the curve steepened to a 48bp gap between the 10Y at 4.68% and the 2Y at 4.2%. With the effective policy rate parked at 3.63%, a front end that holds while the long end sells off is the signature of term-premium expansion, not a repriced hiking path. The channel is direct: every basis point of term premium raises the discount rate on long-dated cash flows, and the instruments confirm the pass-through. TLT closed at 82.26, -0.6% WoW and -5.5% YTD, pinned just above its 82.06 52-week low and flagged slightly oversold; LQD at 106.39 is -3.4% YTD and within half a point of its own 105.96 low, because an investment-grade book has too little spread cushion to absorb a duration shock of this size. Our positioning follows the mechanism. We are underweight the 10Y and TLT, underweight LQD, and overweight the 2Y, where 4.2% of carry against a 3.63% policy rate is the best risk-adjusted point on the curve over one to two quarters. The trade-off is convexity: in a hard-landing scenario the long bond outruns everything and we lag. Our trigger is defined. A close through 4.75% on the 10Y alongside equity weakness flips us from underweight to accumulating duration, because overshoot converts the risk we avoid into the entry we want; a 2Y bid toward its 3.38% 52-week low would do the same via the policy-relief channel.
Equities
US equity indices sit at or near 52-week highs while their own discount rate presses 4.68%; that tension is the section's subject. SPY printed 778.12 (+0.6% WoW, +13.9% YTD), a fresh 52-week high; QQQ added +1.3% WoW to 732.73 (+19.5% YTD), still 1.8% under its 746.16 high; IWM at 303.36 is +21.9% YTD and effectively at its 303.50 peak; EWJ rose +1.6% WoW to 98.41 (+21.0% YTD) with Japanese benchmarks at records. All four US proxies screen slightly overbought. The mechanism holding this together is an earnings channel outrunning the rates channel: AI-linked capital spending and semiconductor results keep the numerator growing faster than the 10Y raises the denominator, and softer producer-price data gave the tape one more week of cover. The sequencing risk is highest where balance sheets are weakest: small caps carry the most floating-rate exposure into a long end that refuses to rally, which makes IWM's +21.9% YTD the most fragile leg of the advance. We hold SPY and QQQ at neutral with a quality tilt, move IWM to underweight, and keep EWJ overweight, where the +21.0% YTD run rests on domestic reflation rather than a US discount rate, with USDJPY at 157.54 (-1.0% WoW) the variable to watch. A 10Y break over 4.75% or HYG through its 78.72 low cuts the whole equity complex to underweight; a crude reversal with yields fading from 4.68% extends the advance and we would add beta.
Digital Assets
Crypto is the one asset class where price and flows agree on risk-off. BTC fell -3.4% WoW to $62,670.8, is -29.4% YTD, and trades 6.9% above its $58,608.4 52-week low; ETH at $1,868.04 is -2.2% WoW and -37.8% YTD. Total crypto market cap sits at $2.26T (-1.05% over 24h) on $424B of daily volume, and BTC dominance at 55.7% shows the drawdown has not yet produced the rotation into majors that usually precedes a durable low. The mechanism is a liquidity-withdrawal loop: US spot ETF flows have turned negative in August, which removes the marginal spot bid, while perp funding stays positive, which means leveraged longs are paying to hold a falling asset, a crowding pattern that resolves through liquidation rather than accumulation. Our on-chain work, detailed in the pulse below, sharpens the picture: Hyperliquid whales are net short BTC and net long ETH, and ETH is the only major with smart-money accumulation and heavy exchange outflows at the same time. We are underweight BTC and neutral ETH, expressed as a relative preference for ETH within a reduced crypto sleeve on a one-quarter horizon; the cost is missing a squeeze if the ETF bid returns violently. A daily close below $58,608.4 on BTC confirms distribution and we would cut further; two consecutive weeks of positive ETF flows with funding resetting lower would neutralize the underweight and re-open the sleeve for additions.
GC Views
| Asset | View | Rationale |
|---|---|---|
| US_10Y | UW | At 4.68%, 7bp from the 4.75% 52w high; term-premium repricing has momentum, we stay short duration. |
| US_2Y | OW | 4.2% carry over a 3.63% policy rate; the best risk-adjusted point on a 48bp-steep curve. |
| TLT | UW | -5.5% YTD, pinned near the 82.06 52w low; no convexity payoff until the 10Y breaks 4.75%. |
| LQD | UW | -3.4% YTD within half a point of the 105.96 52w low; duration drag swamps IG spread carry. |
| SPY | N | Record 778.12 (+13.9% YTD) against a 4.68% discount rate; earnings must keep outrunning term premium. |
| QQQ | N | +19.5% YTD and slightly overbought; the most duration-sensitive multiple on the tape. |
| IWM | UW | +21.9% YTD at the 303.50 high with the weakest balance sheets facing a long end that will not rally. |
| EWJ | OW | +21.0% YTD on domestic reflation; +1.6% WoW leadership persists with USDJPY at 157.54. |
| GLD | OW | +1.1% WoW to $402.80 but only +1.1% YTD vs a $495.90 52w high; cheap insurance on the inflation tail. |
| BTC | UW | -29.4% YTD, whales net short $27.1M, funding +10.95% annualized; $58,608.4 must hold. |
| ETH | N | Only major with $12M smart-money inflow, $276M exchange outflows and a $57.2M whale long; prefer vs BTC. |
| EURUSD | N | 1.1559 (+0.3% WoW) mid-range between 1.1348 and 1.1980; no policy-divergence catalyst either way. |
On-Chain Pulse
Hyperliquid whale books split decisively this week: net short BTC at $27.1M and marginally short BNB, against a $57.2M net long in ETH, the largest single directional position among the majors we track. ETH carries the only clean bullish confluence, with smart money, exchange flows and whale perps aligned, while SOL and BNB show distribution onto exchanges beneath green prices. XRP lacks Nansen smart-money and exchange-flow coverage this week (whales are net short a modest $181.8k with funding at +10.95% annualized), so we exclude it from the cohort read rather than pad the analysis.
Bitcoin's flow picture is bearish on every channel we can measure. Native BTC ledger flows sit outside Nansen's cohort coverage, so the smart-trader read comes via the WBTC proxy only, and we weight it accordingly rather than assign it a hard dollar figure. What we can measure directly is one-directional: holders moved a net +$17.9M onto exchanges over the week while price fell -3.4%, the classic pre-distribution posture. On Hyperliquid, whales run a net short of $27.1M, the largest directional whale book among the five majors, and it dwarfs the proxy smart-money signal in size. Funding still prints +10.95% annualized, which means leveraged longs are paying a double-digit rate to hold a falling asset against a whale cohort positioned the other way. That combination, positive funding plus whale shorts plus exchange inflows, typically resolves lower before it resolves higher. We stay underweight and treat $58,608.4 as the line: a close below confirms distribution, a defended retest with funding resetting would be the first evidence the flush is complete.
Ethereum is the standout, and the divergence from BTC is the week's most tradeable on-chain signal. Smart money accumulated a net +$12M over seven days, the only clean smart-trader inflow among the majors. Exchange flows confirm it: a net $276M left exchanges, the heaviest withdrawal in the group and the opposite of BTC's inflow pattern. Hyperliquid whales are net long $57.2M, more than double the absolute size of their $27.1M BTC short, so the whale book's ETH exposure outweighs its BTC exposure by roughly 2:1 in dollar terms. Funding at +8.46% annualized sits below BTC's +10.95% despite stronger cohort demand, a healthier ratio of positioning to price. Spot and perps agree here, which is rare this week. We express this as neutral ETH against underweight BTC, a relative overweight within the sleeve; a reversal of the exchange outflows or an unwind of the $57.2M whale long sends us back to flat.
Solana's +2.2% weekly price gain is not supported by its flows. Smart money added just +$316k, an immaterial figure next to ETH's +$12M, and holders moved a net +$11.5M onto exchanges, distribution into strength rather than accumulation. Hyperliquid whales are long a modest $6.8M, a fraction of the $57.2M ETH whale long, so long exposure is thin relative to the move. Funding at +4.08% annualized is the lowest positive print among the majors, consistent with a market drifting on low conviction rather than building a base. Green price with red flows is the mirror image of what we want to own. We fade the strength: no allocation add on this bounce, and another week of exchange inflows moves us to an explicit underweight within the sleeve.
BNB carries the worst flow picture of the group despite a +1.9% weekly gain. The headline +$12M smart-money inflow is flagged as a data artifact in our pipeline, so we strike it from the analysis rather than lean on it. The unflagged numbers point one way: a net +$130.9M moved onto exchanges over the week, the largest distribution in the set and an order of magnitude beyond SOL's +$11.5M. Hyperliquid whales are net short $2.3M, small in absolute terms but directionally aligned with the exchange inflows, and funding at -3.98% annualized is the only negative print among the five majors, so the derivatives market leans lower as well. Price up, coins onto exchanges, whales short, negative funding: the tape and the flows disagree, and we side with the flows. We hold no BNB exposure and would revisit only after exchange inflows reverse and funding turns positive.
What We're Watching
Five prints would change our positioning. First, a 10Y close above 4.75% (the 52-week high): we add duration into the overshoot and cut equity beta to underweight. Second, LQD below 105.96 or HYG below 78.72: credit shifts from duration repricing to stress, and equities go underweight the same day. Third, BTC below its $58,608.4 52-week low: on-chain distribution confirmed, crypto sleeve cut further; two weeks of positive spot ETF flows would neutralize the underweight instead. Fourth, USDJPY pressing toward 163.86: intervention risk returns and we trim EWJ despite its +21.0% YTD run. Fifth, a crude reversal with the 10Y fading from 4.68% while SPY holds near 778: the inflation tail deflates, and we lift duration to neutral and add beta.
This Week in Charts