The bond market is doing the Fed's tightening. The US 10Y closed at 5.11% and the 2Y at 4.85%, both 52-week highs, after the Fed's first hike in three years.
Credit is the crack in the risk-on tape. HYG sits at a 52-week low of $77.88 while QQQ rallied +3.0% WoW; we side with credit and go underweight high yield.
The dollar has reclaimed rate leadership. DXY rose +1.1% WoW to 119.51 with USD/JPY at 156.87, and GLD fell -2.2% despite a live geopolitical tape.
Our positioning: The bond market has the story right at 5.11%; we cut duration and lower-quality credit before the equity tape concedes.
The hawkish repricing has moved from rates into credit; equities are the last to adjust
We label this week's regime a hawkish repricing with a credit warning: central banks tightened in unison, the long end broke to cycle highs, and equity indices chose not to care. The US 10Y closed at 5.11%, a 52-week high after a +2.0% weekly rise, while QQQ gained +3.0% to $742.89, within 0.6% of its own high. That pairing is unstable. The Fed delivered its first hike in three years with the ECB and Bank of Japan tightening alongside, so the policy impulse is synchronised for the first time this cycle. Credit is the dissent: HYG sits at a 52-week low of $77.88 and EMB fell -1.3% into oversold territory. Our house view: the bond market has the story right, and the equity tape is running on momentum and concentration. The hierarchy that follows: underweight duration, underweight lower-quality credit, neutral equity beta with a quality-growth tilt, and a stronger dollar as base case.
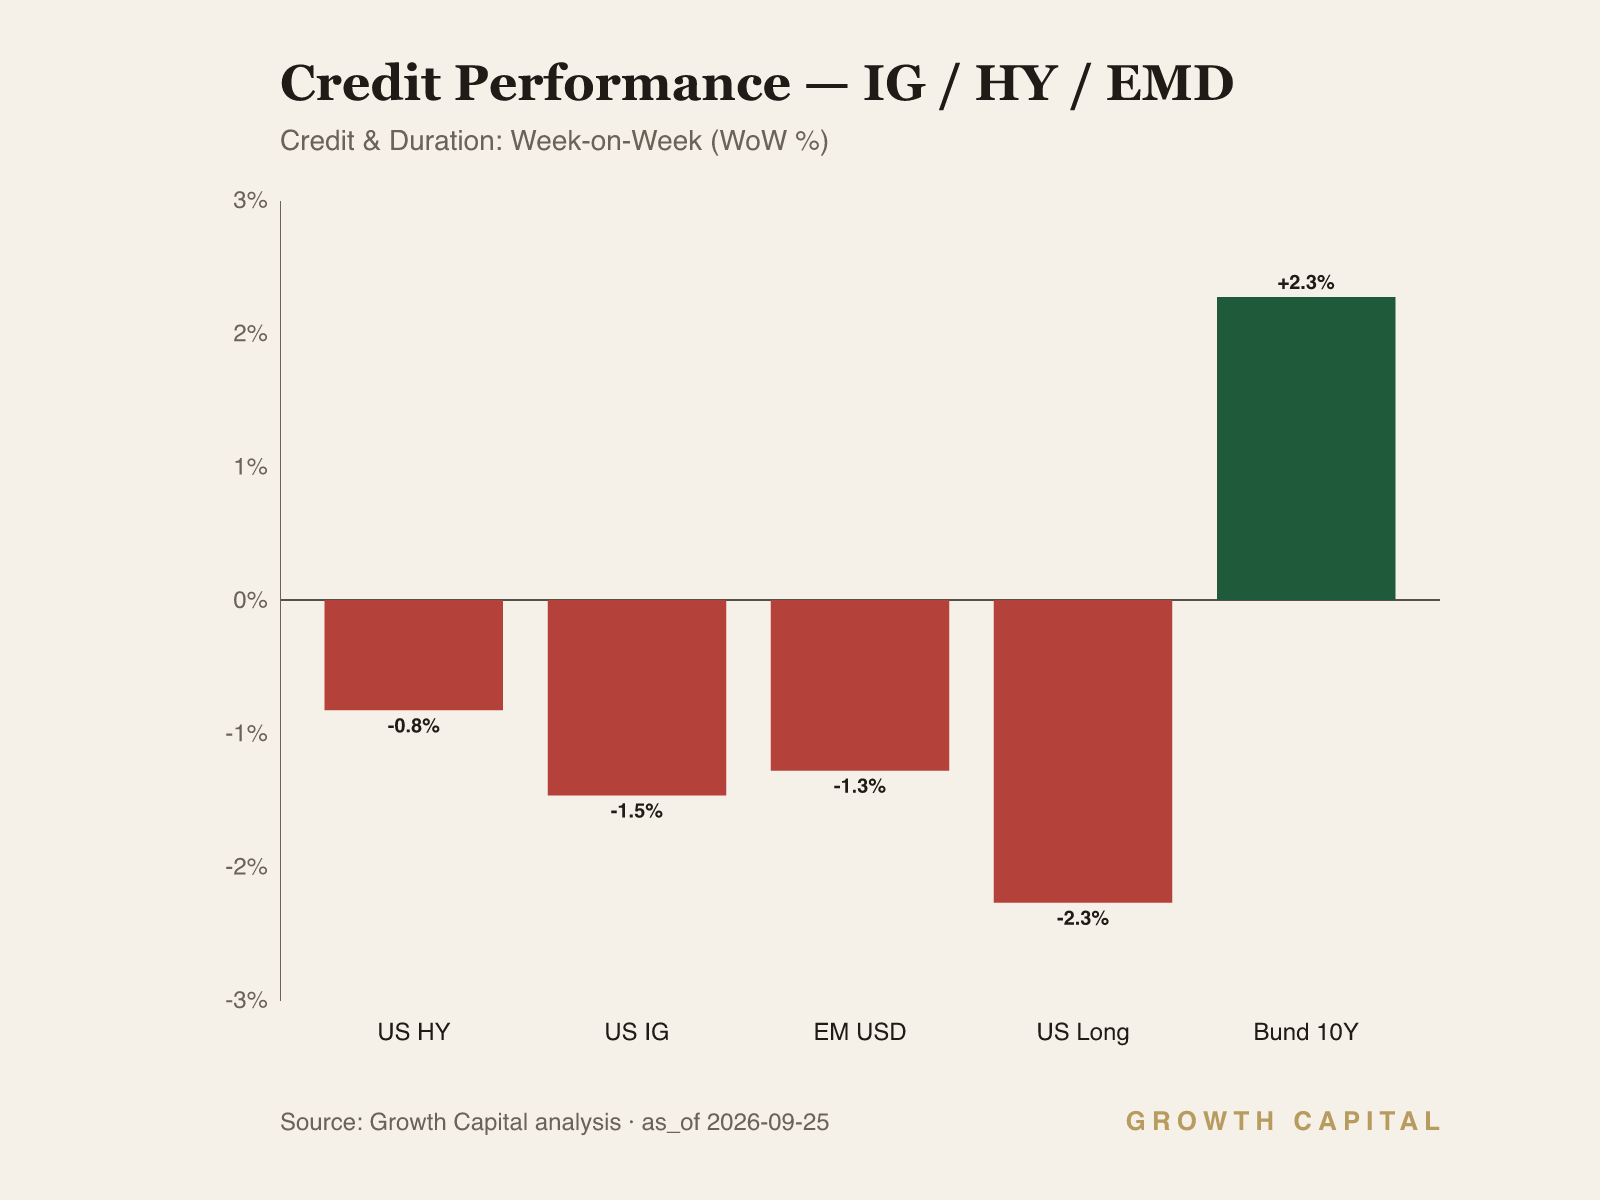
Start at the front of the curve: the 2Y rose +2.3% this week to 4.85%, a 52-week high, and the 10Y at 5.11% sits only 26bp above it, so the whole curve shifted up rather than twisted. Sympathy confirmed the move: the German 10Y Bund printed 3.6%, its own 52-week high, TLT fell -2.3% to a 52-week low of $79.40, and DXY rose +1.1% to 119.51. The transmission channel is rates to duration to multiples, and it runs one link at a time. A resumed hiking cycle lifts the expected policy path and reprices the front end first; the long end then adds term premium because sovereign supply is heavy and foreign buyers of Treasuries face the same repricing at home, which removes the demand that once capped US yields. The pass-through is quantifiable: the 10Y's +2.0% weekly rise produced a -2.3% loss in 20-year Treasuries and pushed LQD -1.5% to $103.17, its effective 52-week low, so investment-grade holders absorb duration losses with no spread cushion left. Positioning follows the channel: underweight long duration on a one-to-three-month horizon, risk parked at the front end where 4.85% of carry pays us to wait. The trade-off is explicit; if growth breaks abruptly we forgo the convexity of a long-bond rally, a cost we accept while unemployment holds at 4.1%. The falsifier is a level: a sustained 10Y close below 4.85%, the yield the 2Y now commands, would flatten the curve toward inversion and tell us the market had shifted from inflation repricing to growth repricing. There the mechanism inverts, duration becomes the hedge again, and we would take TLT from underweight to overweight.
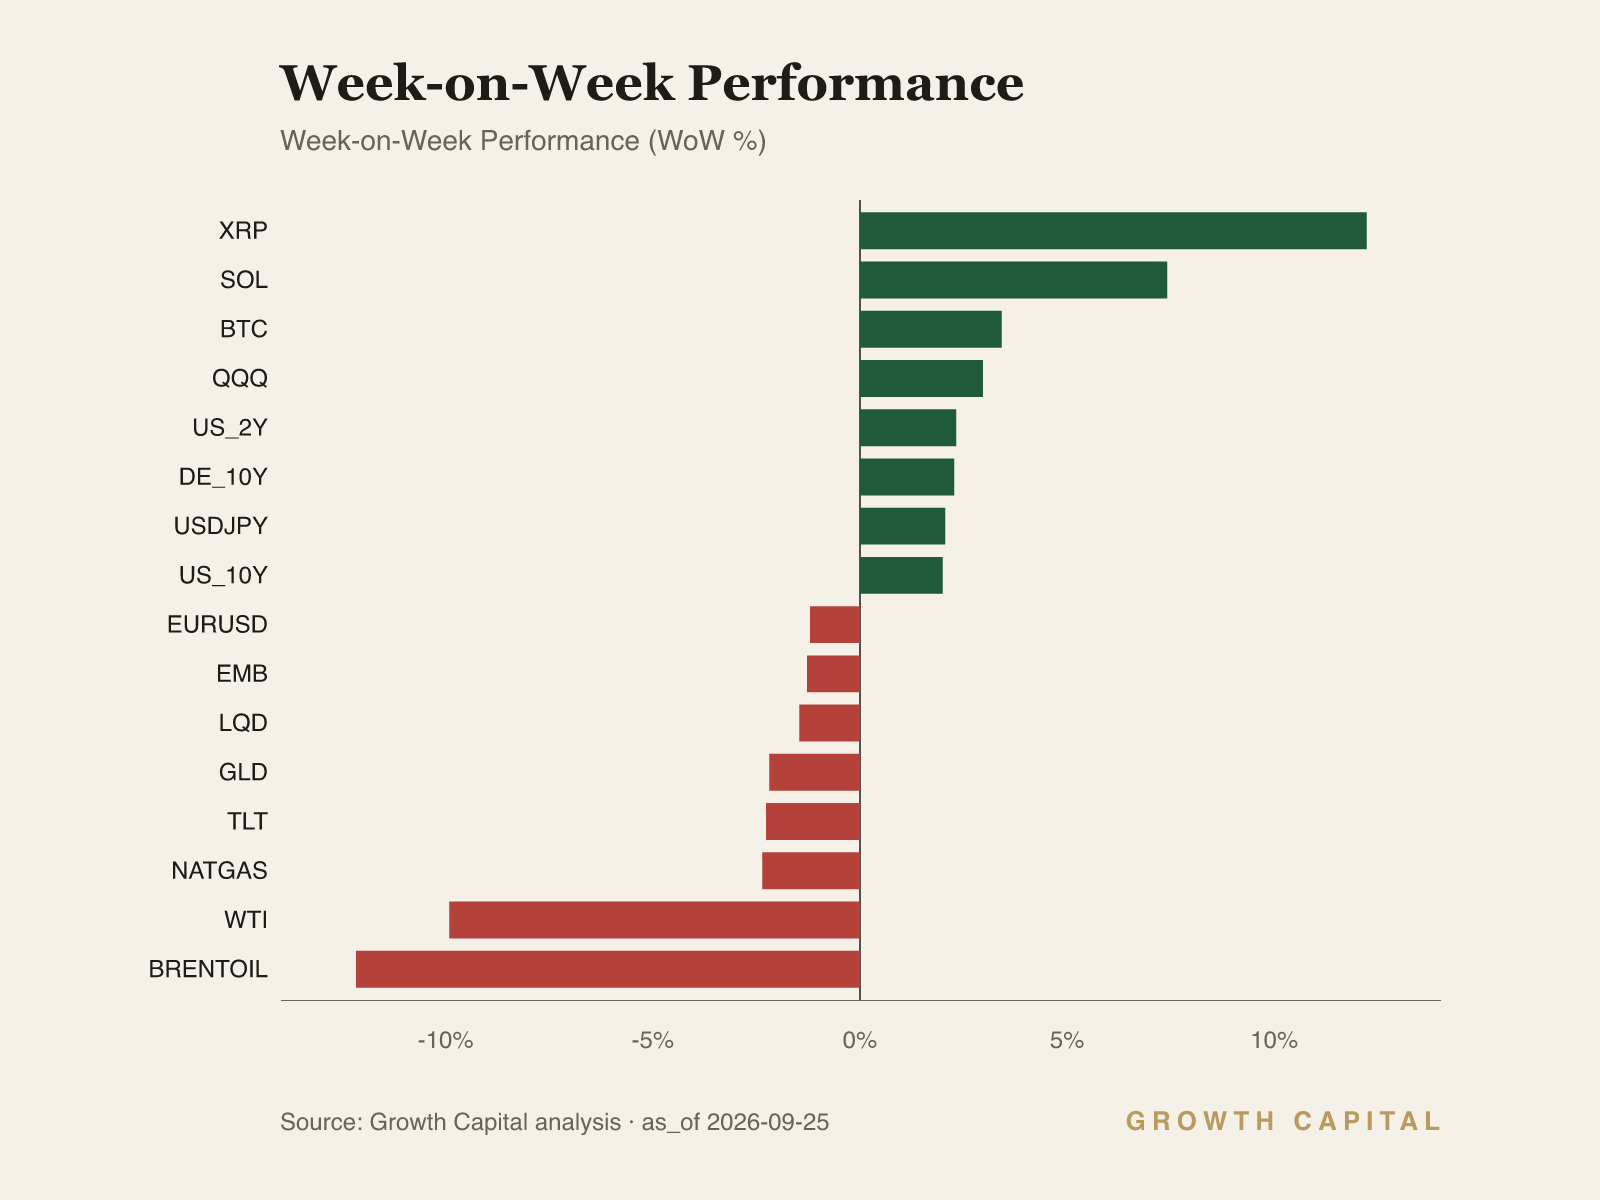
The cross-asset tape disagrees with itself, and that disagreement is the week's most important fact. QQQ rose +3.0% and SPY +1.0% to $769.10, 1.1% below its 52-week high of $777.88; against that, HYG fell -0.8% to a 52-week low, LQD printed its own low, EMB dropped to an oversold $92.19, and IWM fell -0.7% with DIA -0.3%. The reconciling channel is refinancing: rising base rates bind first on the marginal borrower, whose cash outflows start to exceed inflows, and credit prices that constraint immediately. Equity indices, dominated by cash-rich mega-caps, price nominal earnings the hot nominal economy still supports, while momentum crowding concentrates flow into the names carrying QQQ's +21.2% YTD and drains liquidity from small caps at +13.4% YTD. The result is dispersion rather than volatility, which is how the index rallies while its median constituent and its credit both cheapen. The equity tape therefore confirms the regime only at the index level; beneath it, breadth sides with credit, and we resolve the tension in credit's favour. Positioning: neutral equity beta, overweight quality growth against underweight small caps, and underweight high yield outright over a four-to-eight-week horizon, accepting that we lag if the melt-up extends. A weekly HYG close below $77.88 would broaden the warning and take us underweight SPY as well. Conversely, HYG stabilising while IWM turns positive would identify the move as duration repricing rather than default repricing, and we would lift the small-cap underweight.
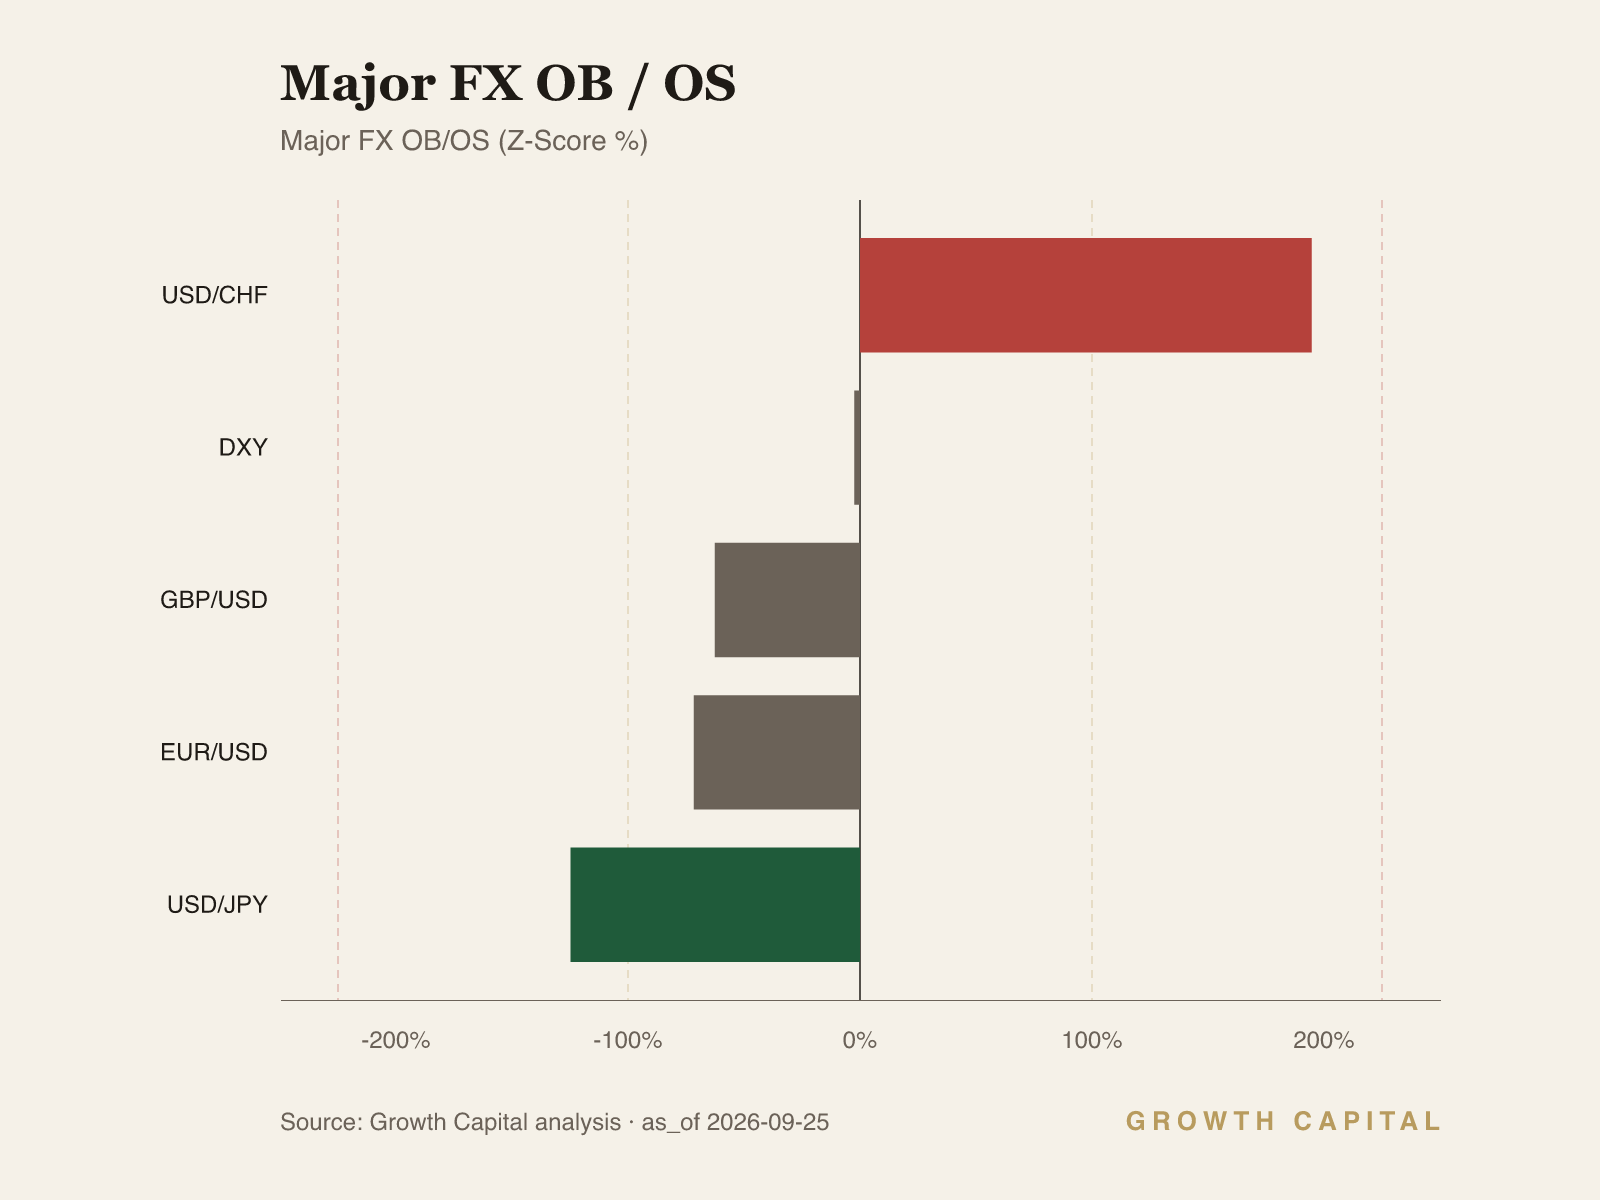
The dollar is the week's second rail and it confirms the regime read. DXY rose +1.1% to 119.51, 2.0% below its 52-week high of 121.92; EUR/USD fell -1.2% to 1.1464 despite the ECB tightening, GBP/USD fell -1.1% to 1.3372, and USD/JPY rose +2.1% to 156.87 through a Bank of Japan hike. The mechanism is the rate-differential channel: the US front end at 4.85% reprices faster than any peer curve, so carry and momentum both point into the dollar; a currency that weakens through its own central bank's hike is a market judging the reaction function behind the curve. Gold is the cross-check: GLD fell -2.2% to $392.39 in a week of live geopolitical risk; a tape where gold falls while war headlines run is a real-rate tape, not a fear tape. Dollar strength on this scale tightens global conditions through the offshore funding channel and reinforces the credit caution above. We stay long-dollar and underweight EUR/USD near term, with USD/JPY's 52-week high of 163.86 the level where intervention risk caps the trade.
Our falsifiers are levels, not moods. Downside: HYG below $77.88 and LQD below $103.15 in the same week would confirm funding stress; we would cut equity beta to underweight, add the 2Y, and expect DXY to press 121.92. Upside: the 10Y back below 4.85% with QQQ clearing $747.46 would signal disinflation without a growth break; we would add duration and extend equity risk beyond the mega-cap tilt. Energy stays at low conviction: our primary feed shows Brent -12.2% WoW on truce headlines, but cross-check pricing diverges beyond our tolerance, so we take direction, not levels, from crude. We will not average the stories; either credit is early or equity is late, and the next fortnight decides it. Watch the 2Y above all: at 4.85% it is the single number the rest of this note keys off.
Source: GrowthCapital analysis; GC cross-asset snapshot, Nansen on-chain intelligence, Hyperliquid derivatives data.
Fixed Income
The week's defining move is a curve-wide selloff to cycle highs. The 10Y closed at 5.11%, +2.0% WoW and a 52-week high with a slightly overbought technical read, while the 2Y rose +2.3% to 4.85%, also a high; the 26bp gap between them says the curve shifted rather than twisted. The German Bund at 3.6%, its own 52-week high, removes any developed-market duration hiding place. The mechanism runs from policy path to term premium to price: a resumed hiking cycle lifts the expected path, heavy sovereign supply forces the long end to clear at higher yields, and the damage compounds with duration, with TLT down -2.3% WoW to a 52-week low of $79.40 and -8.8% YTD. Credit stacks spread risk on top: LQD fell -1.5% to $103.17, effectively its 52-week low, and HYG fell -0.8% to $77.88, an oversold print at the bottom of its range. Oversold is not cheap. High-yield issuers refinancing against a 5.11% risk-free base face debt service that grows faster than income, and that arithmetic worsens each week the curve holds here. We are underweight TLT, LQD and HYG, overweight the 2Y where 4.85% of carry requires no duration bet, and neutral Bunds. The view inverts if the 10Y sustains below 4.85%, the 2Y's current level: that would date the shift from inflation repricing to growth repricing, and duration would resume its role as the portfolio hedge.
Equities
The index tape flatters the regime. QQQ gained +3.0% WoW to $742.89, within 0.6% of its 52-week high of $747.46, and is up +21.2% YTD; SPY added +1.0% to $769.10, about 1.1% below its own high of $777.88. Beneath the surface, breadth is deteriorating exactly as a 5.11% 10Y predicts: IWM fell -0.7% WoW, DIA fell -0.3%, and the YTD gap between QQQ at +21.2% and DIA at +6.3% is the widest expression of rate sensitivity in the equity complex. The mechanism is duration in equity form. Long-horizon cash flows backed by cash-rich balance sheets can absorb a higher discount rate while nominal revenue stays strong; small caps carry floating-rate liabilities and near-term refinancing needs that price like high yield, which is why IWM's weakness and HYG's 52-week low rhyme. Japan is the exception worth owning: EWJ rose +0.6% to $97.56, is up +20.0% YTD in an uptrend, and a yen at 156.87 keeps subsidising exporter earnings. Our stance: neutral SPY, overweight QQQ as the quality-growth expression, underweight IWM, neutral DIA, overweight EWJ. The falsifier for the QQQ overweight is its own high: failure at $747.46 with the 10Y above 5% would tell us even mega-cap duration has hit its discount-rate limit, and we would flatten the tilt. A clean break above $747.46 with the 10Y back under 4.85% is the bullish resolution, and we would add beta rather than trim it.
Forex
Rate leadership moved back to the dollar. DXY rose +1.1% WoW to 119.51, roughly 2.0% below its 52-week high of 121.92, and the gains were broad: EUR/USD fell -1.2% to 1.1464, GBP/USD fell -1.1% to 1.3372, and USD/JPY rose +2.1% to 156.87. The mechanism is the rate-differential channel with a credibility overlay. The US front end at 4.85% repriced faster than any peer curve, so carry points into the dollar; the ECB and the Bank of Japan both tightened this week, yet their currencies fell anyway, which tells us the market judges those hikes as lagging the US path rather than closing the gap. The yen is the clearest case: a central bank hiking into a currency that still weakens is a market pricing the reaction function, not the move. Dollar strength on this scale also tightens global financial conditions through the offshore funding channel, so it reinforces our credit caution rather than offsetting it. We are overweight the dollar and underweight EUR/USD over the next month, and we accept the risk that coordinated intervention or one soft US print unwinds the crowding quickly. Levels discipline the view: USD/JPY at its 52-week high of 163.86 is where intervention risk realistically caps the trade, and a DXY break back below 117.44, the bottom of its 52-week range, would falsify the dollar-leadership thesis outright and signal that markets had begun repricing US growth rather than US rates.
Digital Assets
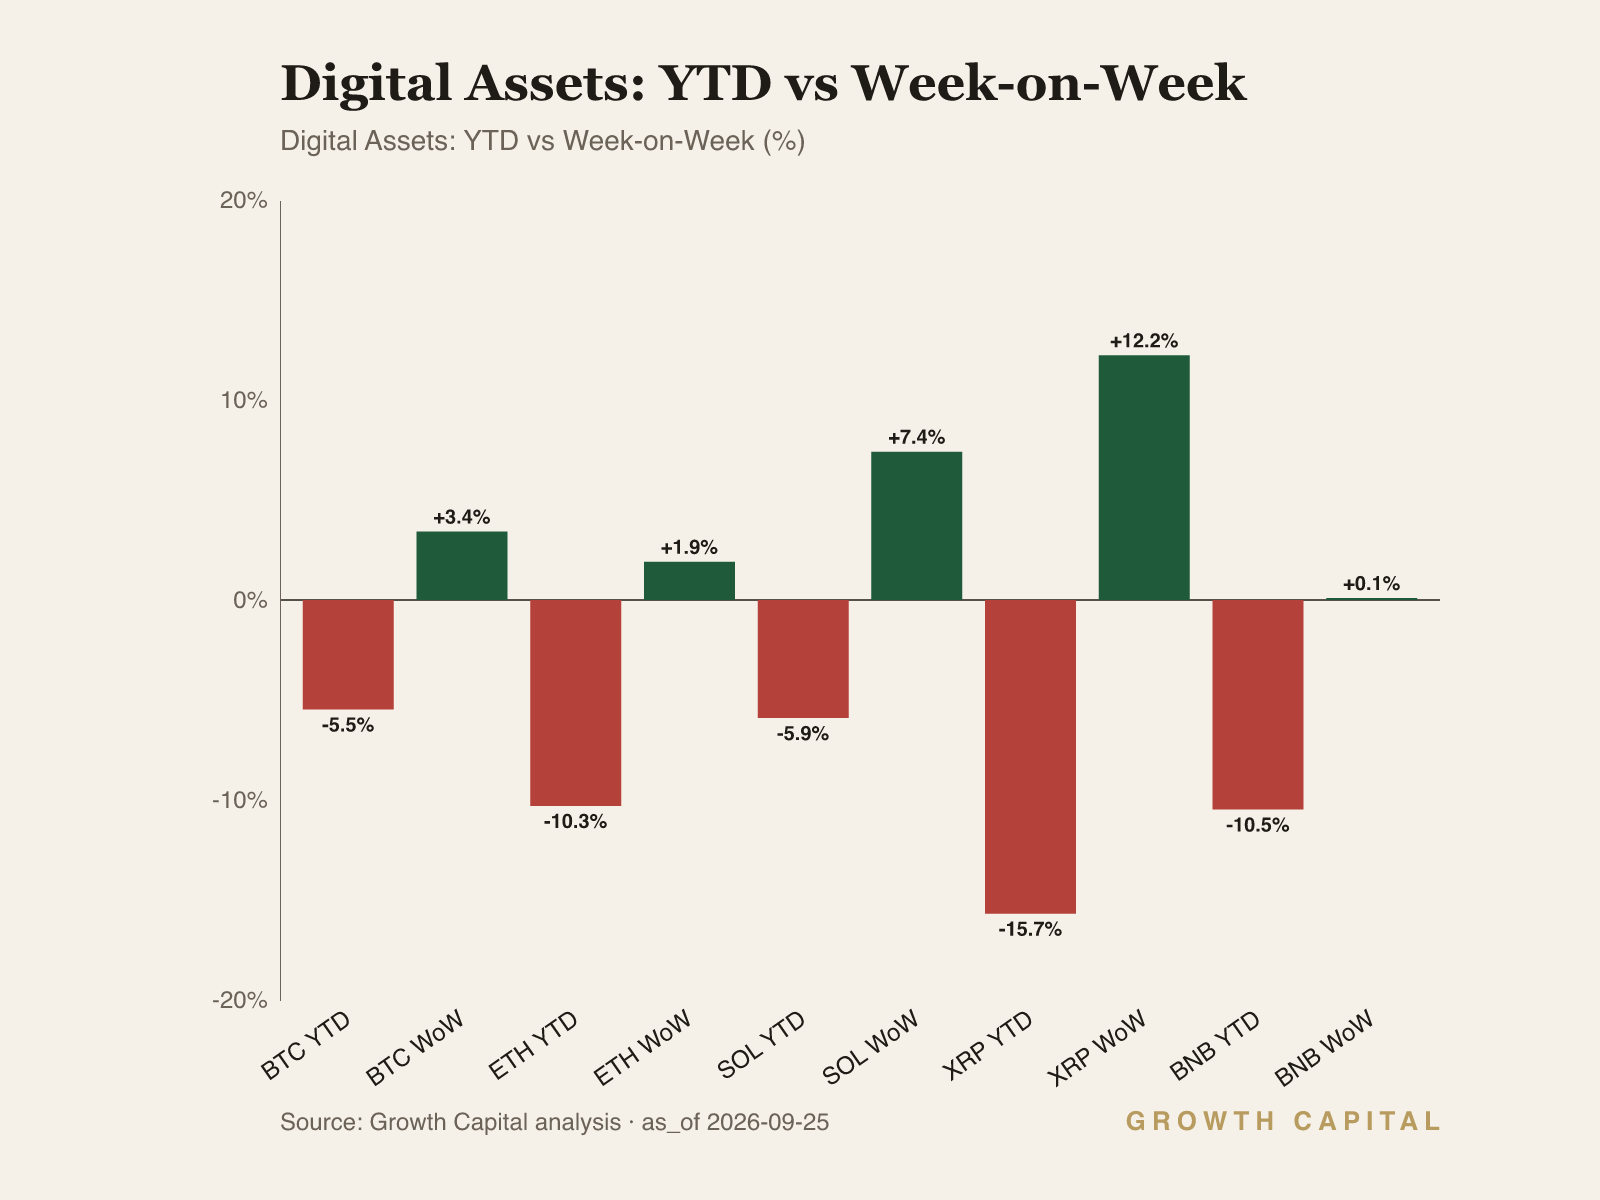
Crypto traded as high-beta risk, not as a rate hedge. BTC rose +3.4% WoW to $83,941, in an uptrend and slightly overbought, though still -5.5% YTD and roughly 13% below its 52-week high of $95,101. The rest of the complex ran harder: XRP gained +12.2% to $1.58, SOL +7.4% to $119.36 and ETH +1.9% to $2,694.65, with BTC dominance at 55.9% and total market capitalisation at $3.02T, up +0.9% over 24 hours. The mechanism is positioning-led: perpetual funding is positive across the majors on Hyperliquid, so the derivatives complex is paying to hold longs, and a long-crowded market rallying into a hawkish rate regime runs on liquidity appetite, not on a macro-hedge story. That configuration produces sharp air pockets when funding resets. The on-chain detail sharpens the split: exchange inflows hit SOL and XRP even as prices rose, a distribution pattern, against exchange outflows and spot accumulation in BTC and ETH. We are neutral BTC and ETH, where flow supports price, and tactically underweight SOL and XRP, where strength is being staged onto exchanges. Two falsifiers govern the stance. A BTC weekly close above $95,101 would force us to re-rate the complex as an early-cycle breakout and add exposure. A loss of BTC's uptrend with funding still positive would confirm the crowding risk, and we would move the whole complex to underweight.
GC Views
| Asset | View | Rationale |
|---|---|---|
| US_10Y | UW | 5.11% is a 52w high, +2.0% WoW; supply and a live hiking path argue against adding duration here. |
| US_2Y | OW | 4.85% of front-end carry pays us to wait with minimal duration risk while the path reprices. |
| TLT | UW | -2.3% WoW to a 52w low of $79.40; duration is uncompensated until the 10Y stabilises. |
| LQD | UW | -1.5% WoW to $103.17 at the 52w low; IG stacks spread risk on duration into a hiking cycle. |
| HYG | UW | 52w low at $77.88; refinancing against a 5.11% base rate is the unpriced risk; oversold is not cheap. |
| SPY | N | +1.0% WoW to $769.10, 1.1% off the high; earnings hold but the multiple fights a 5.11% 10Y. |
| QQQ | OW | +3.0% WoW, +21.2% YTD; cash-rich mega-caps absorb the discount-rate shock better than the average stock. |
| IWM | UW | -0.7% WoW; small caps carry the floating-rate refinancing burden that HYG's 52w low is pricing. |
| DXY | OW | +1.1% WoW to 119.51; the US front end at 4.85% reprices faster than any peer curve. |
| EURUSD | UW | -1.2% WoW to 1.1464; ECB tightening lags the US path and the differential still widens. |
| GLD | UW | -2.2% WoW to $392.39; rising real yields tax a zero-carry asset even in a war-adjacent week. |
| BTC | N | +3.4% WoW to $83,941 with exchange outflows, but 10.95% annualised funding is a crowding cost. |
On-Chain Pulse
The aggregate on-chain pattern is a split tape. Derivatives are uniformly long-biased, with positive perpetual funding across all five Hyperliquid majors, while spot flows diverge sharply by asset: ETH shows the cleanest accumulation, BTC shows exchange withdrawals against modest smart-money trimming, and SOL, XRP and BNB all show exchange inflows into strength. Fund-only aggregated spot net-flow data was unavailable for these identifiers this week, so the cohort figures below combine Nansen-labelled smart traders and funds.
BTC's cohort read is constructive with a caveat. Smart Money spot flow in WBTC was a net -$288.2k over seven days across nine addresses, flat at $0 over the past 24 hours, which is modest trimming rather than an institutional exit. The exchange side is more decisive: exchange wallets recorded a $30.7M net WBTC outflow over the week, top-PnL wallets withdrew a further $39M net, and public-figure wallets pulled $16.2M; each of those flows reduces immediately sellable supply. Derivatives lean the same way: BTC perpetuals gained +10.08% over seven days, open interest stands at $3.4B on $24.4B of period volume, taker buy-minus-sell flow was +$21.6M, and funding runs 0.00125% hourly, roughly 10.95% annualised, a paid-to-be-long configuration. Among named entities, Selini Capital added a $4M BTC long and later reduced it, so even the visible fast money is trading the range rather than pressing a trend. Whale-specific perpetual exposure ratios were not separately surfaced this week, which caps how hard we lean on the cohort read. Positioning implication: neutral; spot withdrawals support the tape at $83,941, but 10.95% annualised funding is a crowding cost that argues against adding into a slightly overbought print.
ETH carries the cleanest spot-flow accumulation signal of the five majors on the Nansen tape this week. The bid extends into regulated wrappers: US spot ETH ETF flows were uniformly positive, led by ETHA at $26.8M, FETH at $21.5M and the Grayscale mini trust at $17.8M, with no fund in net outflow. Hyperliquid ETH funding is positive alongside the other majors, so the perp market pays to hold the long side even as spot absorbs supply. Accumulation against a modest +1.9% weekly move to $2,694.65 reads as patient buying rather than chase. Smart-trader and whale dollar sizing was not separately published for ETH this week, so we weight flow direction over magnitude. Positioning implication: neutral with a constructive lean; ETH is the major we would add first if BTC dominance at 55.9% rolls over.
SOL is the opposite configuration. Price rose +7.4% on the week to $119.36 into a slightly overbought read, and Nansen flags material exchange inflows over the same window. Coins that move onto exchanges during a rally are supply staged where it can be sold; that is distribution, not accumulation. Hyperliquid SOL funding is positive, so leverage is long into that inbound supply, the setup that produces outsized downside wicks when funding resets. Cohort dollar sizing was not separately surfaced for SOL, which limits conviction on who is distributing. Positioning implication: tactically underweight; we would revisit only when exchange flows flip to net outflow while funding cools.
XRP ran hardest of the majors, +12.2% WoW to $1.58, with the same warning attached: material exchange inflows even as price rose. A +12.2% weekly gain still leaves a -15.7% YTD asset, so this is a squeeze inside a drawdown, not a trend reclaim. Hyperliquid XRP funding is positive, so a paid-long crowd sits on top of the inbound exchange supply. The slightly overbought technical read reinforces the exit-liquidity risk after a double-digit week. Cohort dollar sizing was not separately available, so we anchor on flow direction. Positioning implication: tactically underweight; strength here is for reducing, not for initiating.
BNB is the quietest tape of the five, +0.1% WoW to $772.84, yet the flow signal matches SOL and XRP: material exchange inflows over the week. Supply that arrives on exchanges without a price rally is the weaker configuration, because there is no strength available to absorb it. Hyperliquid BNB funding is positive with the rest of the complex, so even the flat tape carries a long-paying crowd. The asset is -10.5% YTD and sits mid-range against its 52-week band of $545.85 to $946.38. Cohort-level dollar flows were not separately published, so the read is directional only. Positioning implication: no position; a flat price with inbound exchange supply and positive funding offers no edge on either side.
What We're Watching
Five levels govern the view. If the 10Y sustains below 4.85%, the yield the 2Y currently pays, the repricing has flipped from inflation to growth and we move duration from underweight to overweight. If HYG closes a week below $77.88 with LQD below $103.15, credit stress has broadened and we cut equity beta to underweight. On the upside, QQQ clearing $747.46 while the 10Y holds below 5% would justify extending equity risk beyond the mega-cap tilt. In FX, USD/JPY at 163.86 is where intervention risk caps the dollar trade, and a DXY break below 117.44 falsifies dollar leadership outright. In crypto, a BTC weekly close above $95,101 forces a re-rate of the complex as an early-cycle breakout.
This Week in Charts