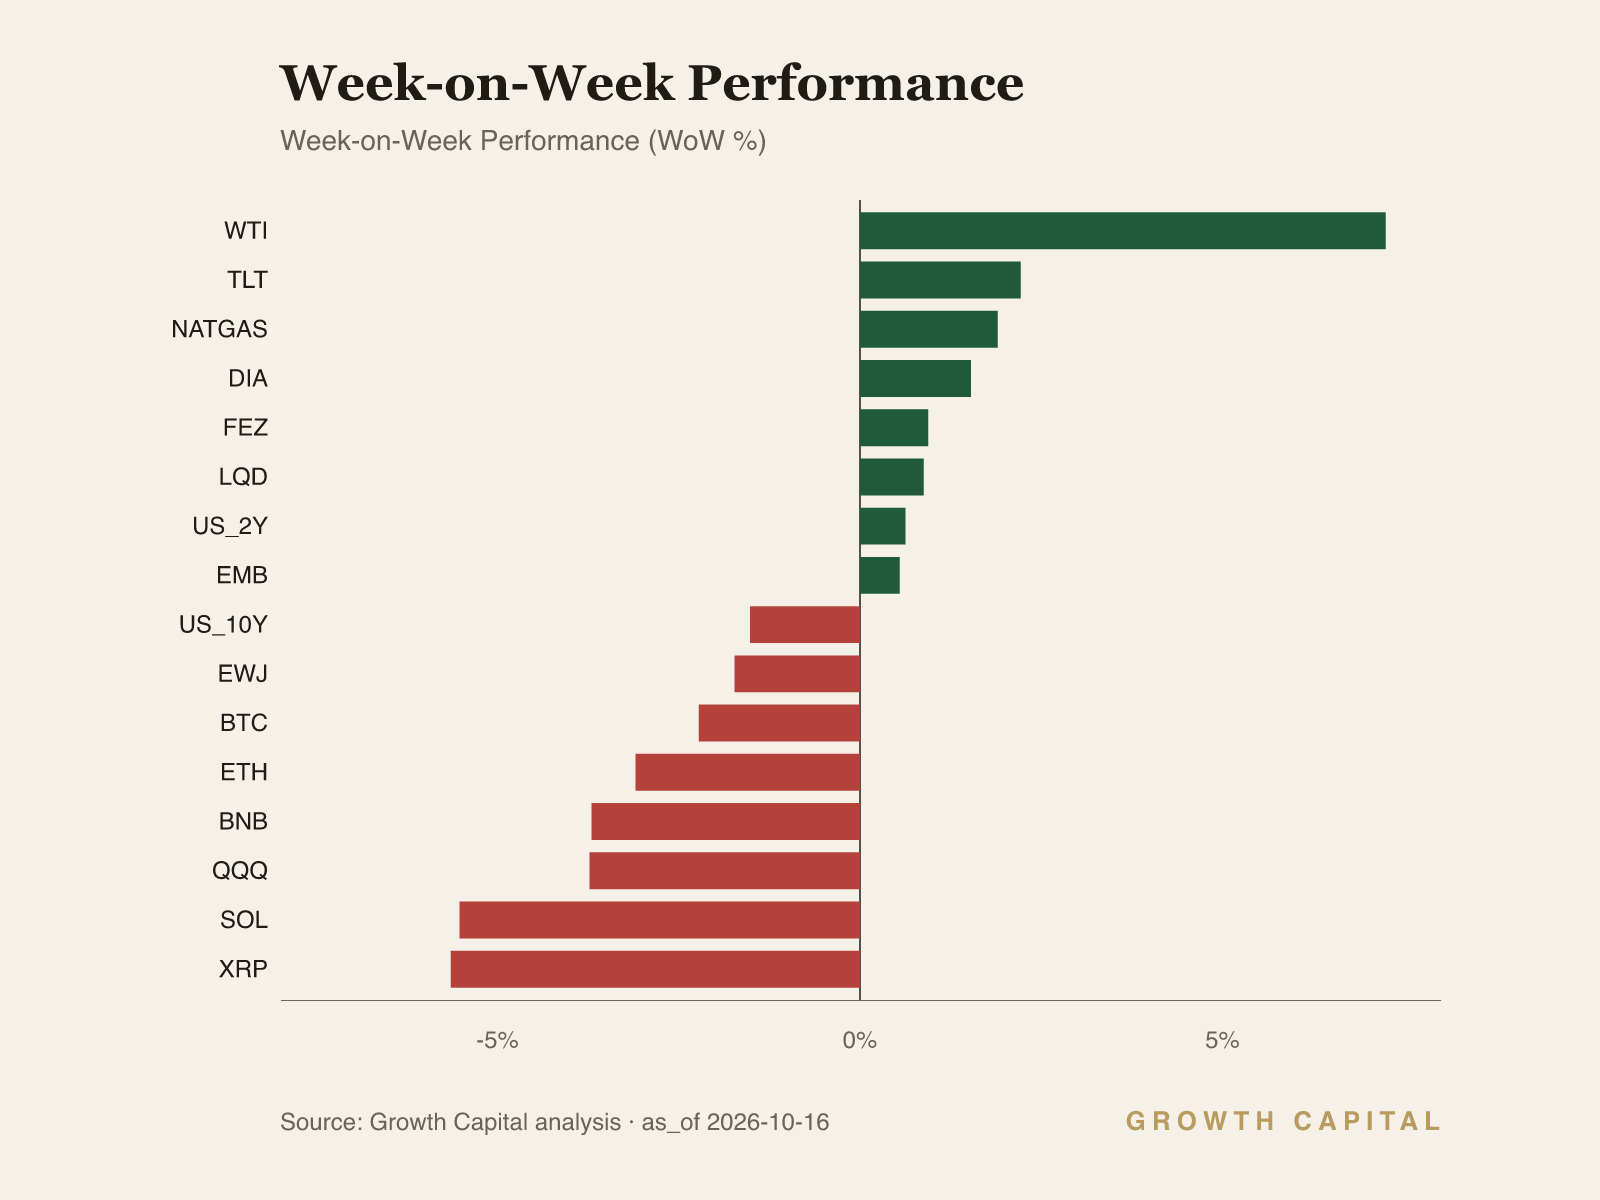
The long end is pricing the growth cost of a hawkish front end. The 10Y yield fell -1.5% WoW to 5.19% while the 2Y rose +0.6% to 4.82%, leaving a 37bp gap.
The AI rotation is a credit story as well as an equity one. QQQ fell -3.7% WoW against DIA at +1.5%, and HYG at 77.06 sits $0.25 above its 76.81 52-week low while LQD gained +0.9%.
The dollar trades on the front end, and on-chain cohorts are split. EUR/USD fell -0.6% to 1.1193, six pips above its 52-week low, while ETH saw a $399.3M net exchange outflow against a $231.8M SOL net inflow.
Our positioning: The front end is still pricing tightening and the long end is paying for its growth cost; own duration and underweight high yield.
A hawkish front end is buying the long end and pricing stress into high yield
Our house view is a late-cycle hawkish hold with a credit warning: the policy rate is pinned at 3.75%, the front end keeps pricing further tightening, and the financing chain behind AI capex is starting to show strain in the weakest corner of credit. The 2Y Treasury yield rose +0.6% WoW to 4.82% while the 10Y fell -1.5% WoW to 5.19%, so the curve flattened from both ends inside one week. The Nasdaq-100 proxy QQQ lost -3.7% WoW while the Dow proxy DIA gained +1.5%, a 5.3 percentage-point gap that shows the market repricing duration-sensitive growth rather than exiting equities. We read the combination as a central bank still leaning against inflation while long-horizon investors buy protection against the growth cost of that stance. This regime differs from the momentum-led advance that carried QQQ to +18.0% YTD, and we position for the new one. Our draft tilt for CIO review is overweight long-dated Treasuries and the Dow, underweight high yield and the Nasdaq-100, and neutral on the S&P 500 in aggregate. Each call carries a named falsifier in the final paragraph.
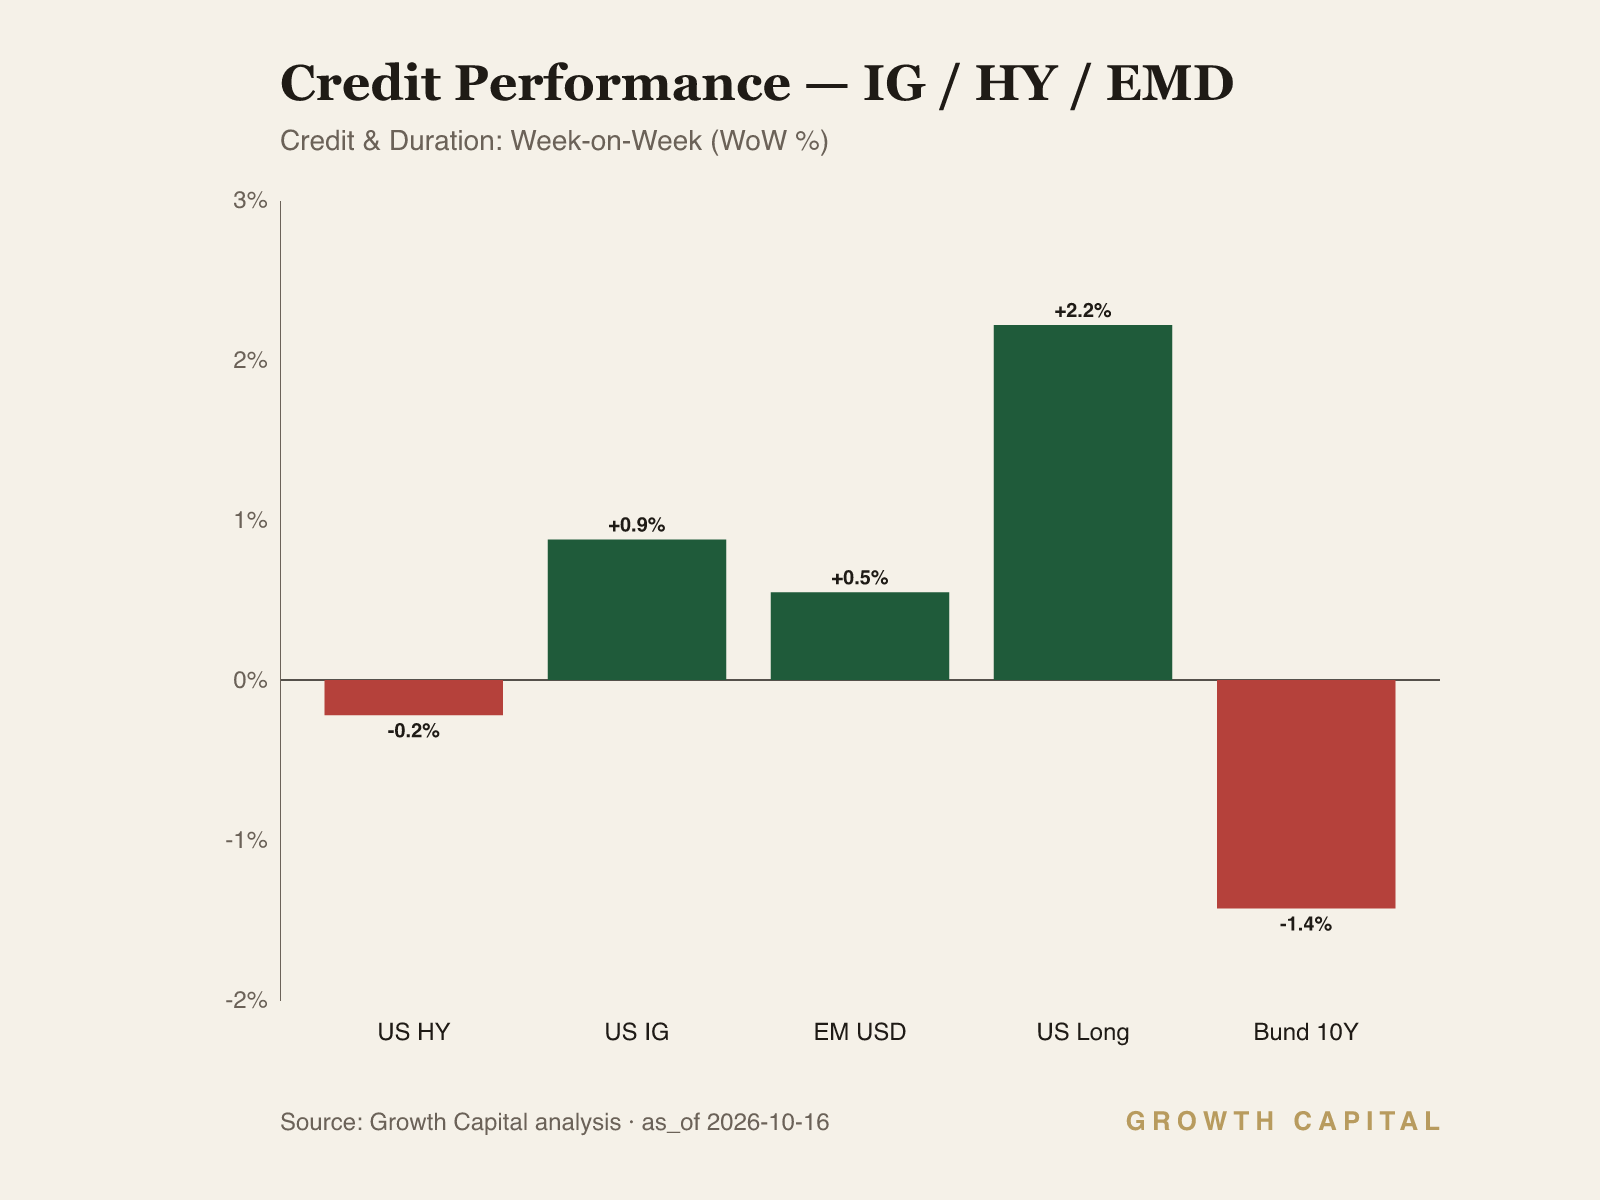
The 10Y yield at 5.19% sits 12bp below its 5.31% 52-week high, and the 2Y at 4.82% is 10bp shy of its 4.92% high, so both legs remain near cycle extremes after a year of repricing. The 10Y at 5.19% versus the 2Y at 4.82% leaves a 37bp gap, and the long-end bid was transatlantic: TLT rallied +2.2% WoW and the German 10Y Bund fell -1.4% WoW to 3.45%. The transmission runs from the policy reaction function to the long end, and it starts with fed funds at 3.75% against the 2Y at 4.82%, a 107bp gap that means the front end is pricing further hikes rather than a pause. Each hike priced at the front lowers the expected path of nominal growth and inflation several years out, and that compresses the expectations component of the 10Y even as the front end rises. Real-money buyers then lock in yields above 5% against a growth path that policy is deliberately slowing, and the price effect is magnified in duration, where a -1.5% relative move in the 10Y yield delivered +2.2% in TLT. We are overweight long-dated US Treasuries over a three-to-six-month horizon, funded from high yield; we accept mark-to-market losses if the 2Y grinds through its 4.92% high before the long end peaks, because a 5.19% starting yield pays us to wait. We would invert the call if the 10Y closes above its 5.31% 52-week high while the 2Y holds below 4.92%. That combination would signal a term-premium shock from supply or inflation expectations rather than growth, and in that regime duration stops hedging equity risk.
The equity and credit tape confirms our P1 regime read rather than contradicting it. SPY fell -0.8% WoW to 772.37, just 0.9% below its 779.09 52-week high, but beneath the index QQQ dropped -3.7% and IWM -1.3%, while HYG slipped -0.2% to 77.06, $0.25 above its 76.81 52-week low, and LQD gained +0.9%. The channel is AI capex financing: hyperscalers have funded data-center build-outs through heavy long-dated bond issuance and off-balance-sheet lease and private-credit structures, so a higher discount rate hits the equity multiple and the leveraged funding chain at the same time. As the front end prices more tightening, the cost of rolling that private credit rises, the weakest borrowers reprice first, and high-yield prices fall even as investment grade rallies on its duration. The resolving number is the quality spread: LQD at +0.9% WoW versus HYG at -0.2% is a 1.1 percentage-point gap in one week, which tells us credit is pricing default risk on top of rates. We are underweight HYG and QQQ and overweight DIA over three months; the trade-off we accept is lagging if AI earnings re-accelerate, because momentum has been the dominant premium this year and QQQ remains +18.0% YTD. We would reverse both underweights if QQQ reclaims its 759.66 52-week high while HYG holds above its 76.81 low. That pairing would show the market absorbing the tightening path without stress in the funding chain, the condition under which momentum resumes.
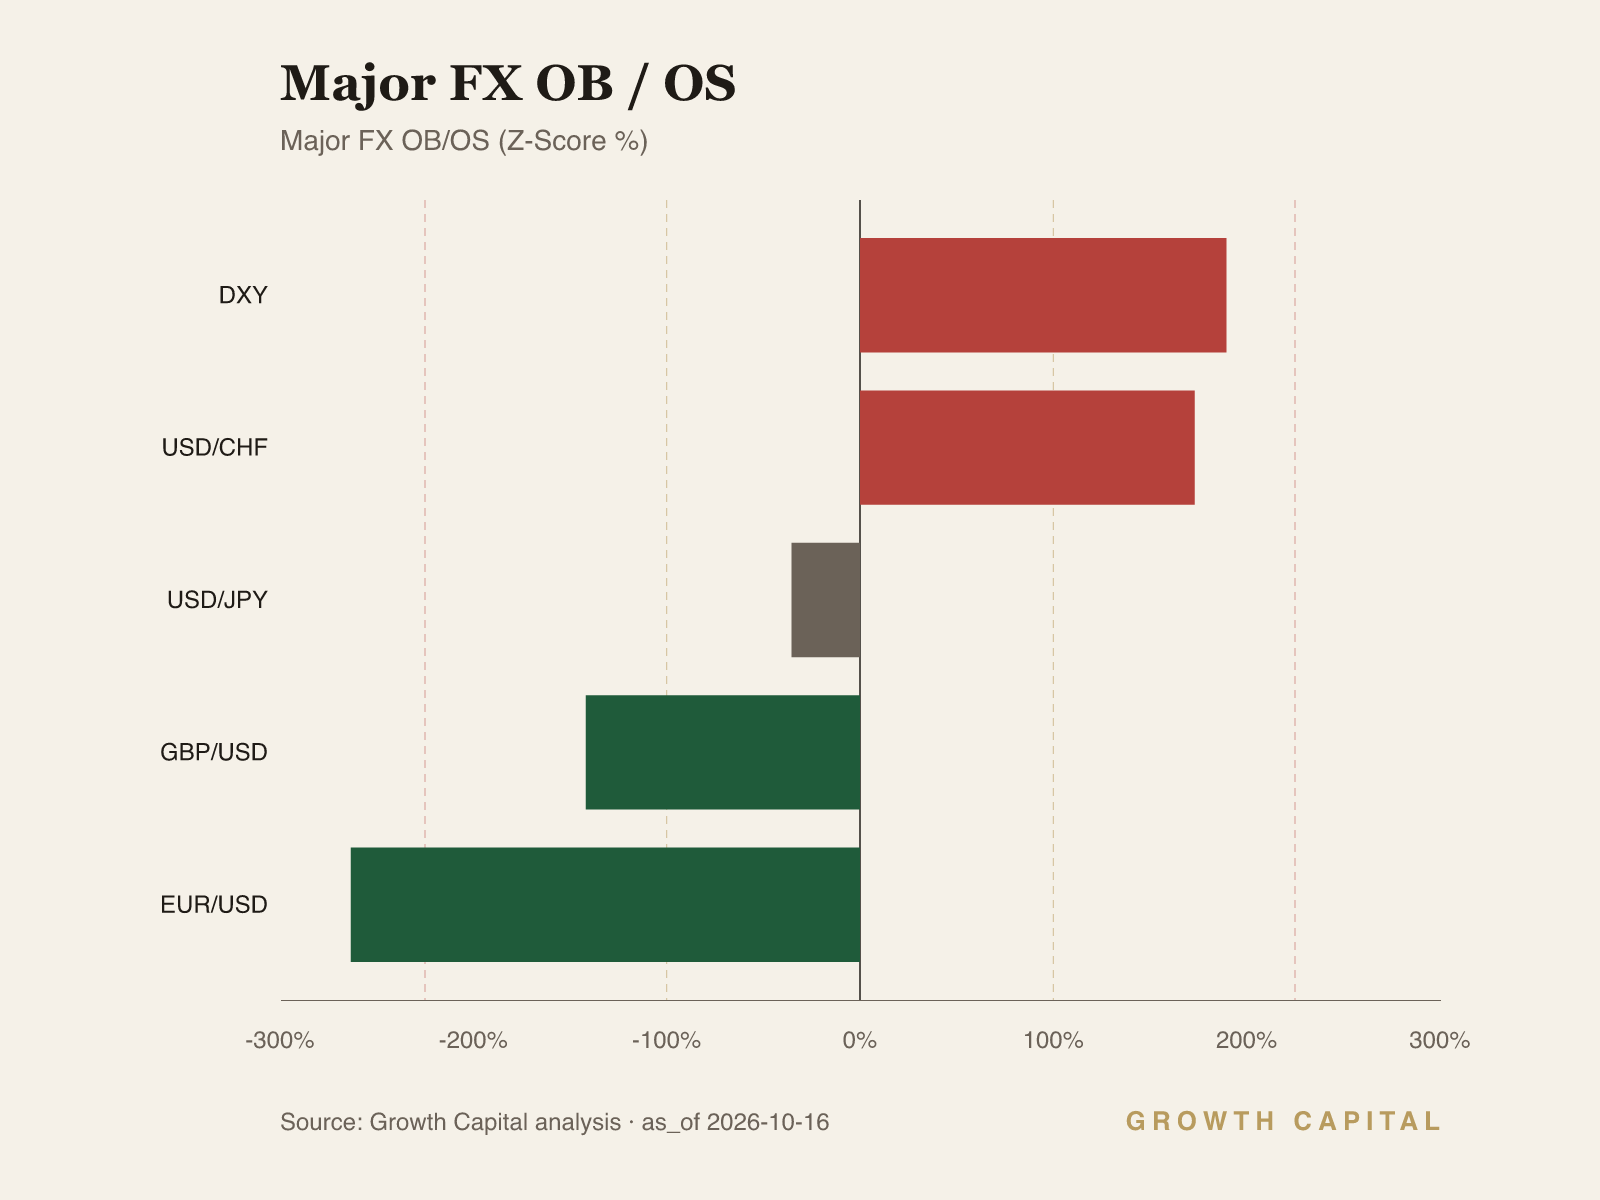
Our second rail is the dollar, and it reinforces the late-cycle read. The broad dollar index rose +0.2% WoW to 121.60, within 0.3% of its 121.92 52-week high, while EUR/USD fell -0.6% to 1.1193, six pips above its 1.1187 52-week low and flagged oversold. USD/CHF rose +0.2% to 0.8308 and USD/JPY +0.3% to 158.34, so the dollar gained against both traditional havens despite a falling 10Y yield. That pattern says the currency is trading on relative policy hawkishness at the front end, where the 2Y rose, rather than on long-end yields. A firm dollar alongside an equity rotation is risk-off in character, which is coherent with our P1 regime and with gold, where GLD posted -0.7% WoW to 381.89 and sits -4.1% YTD as nominal yields above 5% raise the cost of holding a non-yielding asset. We hold EUR/USD and GLD at neutral, because both trade near extremes without a catalyst before the 27-28 October FOMC.
What would change our view is a break in specific named levels. On the downside, if HYG breaks below its 76.81 52-week low while the 2Y pushes through its 4.92% high, we would read tightening as forcing deleveraging in the AI financing chain and cut equity beta further, starting with IWM, which lost -1.3% WoW and already trades well below its 305.09 high. On the upside, if SPY clears its 779.09 high with QQQ back above 759.66 and HYG rising alongside, the credit warning would be void and we would move SPY to overweight. Energy is the risk we cannot size: our primary feed shows Brent at $126.55/bbl while the cross-check source prints $103.20, an 18.45% divergence, so we hold crude at neutral and draw no inflation inference from the level. Absent any of these breaks, we keep the duration overweight and the credit underweight into the 27-28 October FOMC.
Source: GrowthCapital analysis; FRED, ETF and FX market data; Nansen on-chain flows; BIS Quarterly Review (Mar 2026) on hyperscaler financing structures.
Fixed Income
The 10Y yield closed at 5.19%, -1.5% WoW and 12bp below its 5.31% 52-week high, while the 2Y rose +0.6% WoW to 4.82%, within 10bp of its 4.92% high. The 10Y at 5.19% versus the 2Y at 4.82% is a 37bp gap, and with fed funds at 3.75% the 2Y carries a 107bp premium over the policy rate. That premium is the market pricing additional tightening, and it is the start of our causal chain. Each increment of expected tightening lifts the front end and lowers the expected nominal growth path, which compresses the long end; the week's evidence is TLT at +2.2% WoW and the Bund at 3.45%, -1.4% WoW. In credit, the same tightening raises refinancing costs for leveraged borrowers, which is why LQD rose +0.9% WoW on its duration while HYG fell -0.2% to 77.06, only $0.25 above its 76.81 52-week low. Both credit proxies remain negative YTD, LQD at -6.2% and HYG at -4.5%, so neither has repaired the damage from the yield rise. We are overweight the 10Y and long duration, neutral on LQD and the 2Y, and underweight HYG over three to six months. The trade-off is giving up the high-yield spread, which we accept because the leveraged funding chain is the part of the market least able to absorb another hike. Our falsifier is a 10Y close above 5.31% with the 2Y stable below 4.92%. That would indicate a term-premium shock rather than a growth signal, and we would cut duration to neutral and move LQD to underweight.
Equities
SPY fell -0.8% WoW to 772.37 and sits 0.9% below its 779.09 52-week high, so the index level masks a sharp internal rotation. QQQ dropped -3.7% WoW to 723.23 while DIA rose +1.5% to 524.01 and IWM lost -1.3%; outside the US, EWJ fell -1.7% and FEZ gained +0.9%. The pattern is a rotation out of long-duration growth into cash-generative value, and it is global. The transmission runs through the discount rate first: with the 2Y at 4.82%, the hurdle rate on AI infrastructure rises, the payoff horizon on data-center capex lengthens, and the multiple paid for distant cash flows compresses first in the Nasdaq-100. The same tightening raises borrowing costs for the vehicles financing that build-out, which links the equity drawdown to HYG trading $0.25 above its 52-week low. Upbeat semiconductor guidance this week did not offset that discount-rate effect at index level, and QQQ closed 4.8% below its 759.66 high. We are underweight QQQ, overweight DIA and neutral on SPY over a three-month horizon. The trade-off is momentum: QQQ remains +18.0% YTD against SPY at +13.1% and DIA at +8.3%, and momentum premia can persist for months before they reverse. We would cover the QQQ underweight if it reclaims its 759.66 high while the 2Y holds below its 4.92% high. That would show the market absorbing the tightening path without further multiple compression, and DIA's relative edge would fade with it.
Forex
The broad dollar index rose +0.2% WoW to 121.60, 0.3% below its 121.92 52-week high and +1.7% YTD, while EUR/USD fell -0.6% to 1.1193, six pips above its 1.1187 52-week low and screening oversold. The dollar held its bid even as the 10Y yield fell -1.5% WoW, which tells us the currency is trading on the front end rather than the long end. The mechanism is the relative policy path. The 2Y rose +0.6% to 4.82% while the Bund 10Y fell -1.4% to 3.45%, and the 10Y at 5.19% versus the Bund at 3.45% leaves a 174bp transatlantic gap that keeps the carry case for the dollar intact. A wider differential draws carry capital into dollar assets, which raises demand for the dollar against the euro, and the euro's -4.6% YTD decline is the cumulative pass-through. USD/CHF at 0.8308, +4.9% YTD, and USD/JPY at 158.34, +0.3% WoW, show the dollar beating the traditional havens as well. We are neutral on EUR/USD and on the dollar index over one to three months. Carry favours the dollar, but both sit at 52-week extremes where positioning is crowded and a single soft US print can force a sharp reversal; the trade-off is forgoing the residual carry. We would move EUR/USD to underweight on a weekly close below its 1.1187 52-week low. That break would confirm that euro-area tightening has failed to offset the US front-end premium, and the dollar index would then likely clear its 121.92 high.
Digital Assets
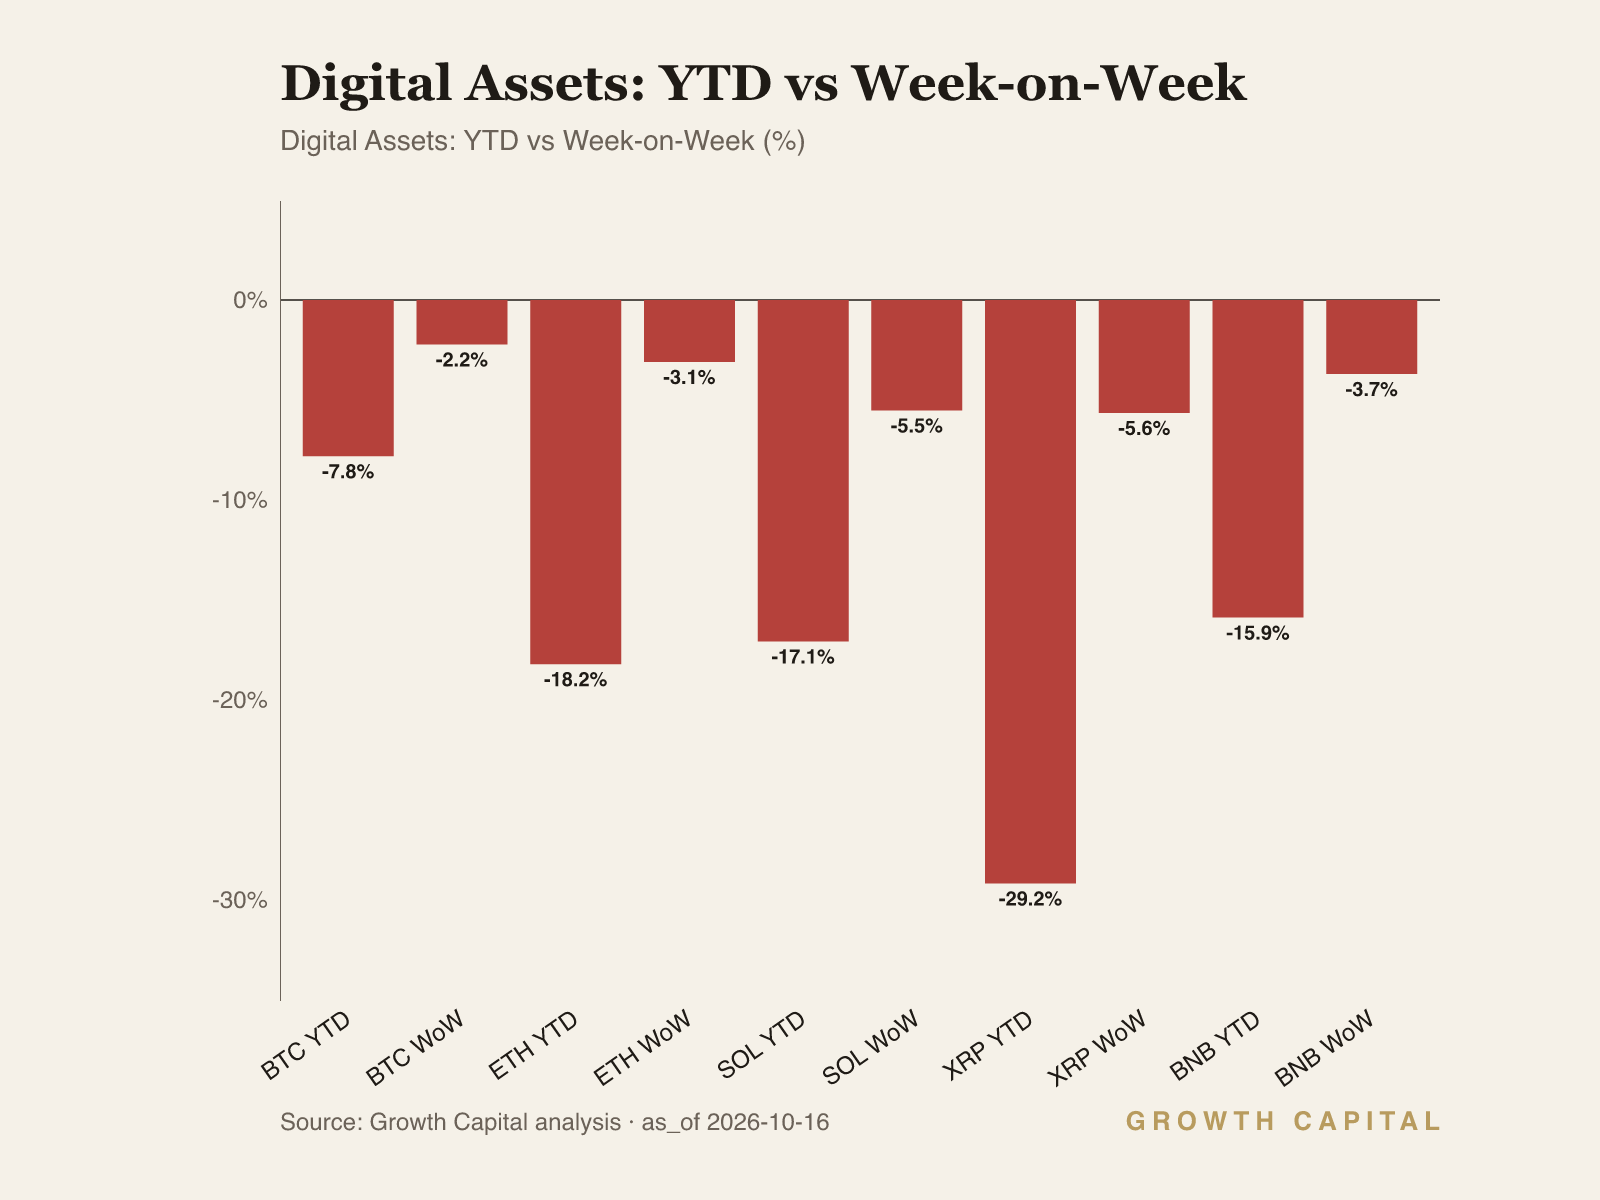
Bitcoin fell -2.2% WoW to 81,865.1 and is -7.8% YTD, 5.5% below its 86,599.2 52-week high, while ETH lost -3.1%, SOL -5.5%, XRP -5.6% and BNB -3.7%. Higher-beta tokens fell further than BTC, and BTC dominance stands at 57.07% of a $2.89T total market capitalisation. The ordering matches a liquidity-driven drawdown rather than an asset-specific shock. The mechanism runs from the front end to leverage: with the 2Y at 4.82%, the opportunity cost of holding non-yielding tokens rises, funding for levered long positions becomes more expensive, and the marginal buyer retreats from the highest-beta assets first. That is why SOL and XRP, at -17.1% and -29.2% YTD, have lost far more than BTC. The on-chain data splits the majors: ETH saw a $399.3M net exchange outflow over seven days while SOL saw a $231.8M net inflow, so holders are withdrawing ETH while moving SOL into position for sale. We are neutral on BTC and ETH and underweight SOL over a one-to-three-month horizon. The trade-off is reduced upside participation if the Nasdaq rebounds, since crypto has tracked equity risk appetite through this drawdown. We would upgrade BTC to overweight if it reclaims its 86,599.2 high while HYG holds above its 76.81 low. That combination would signal leverage rebuilding without credit stress, the condition that has preceded every durable crypto advance in a tightening regime.
GC Views
| Asset | View | Rationale |
|---|---|---|
| US_10Y | OW | 5.19% is 12bp under the 5.31% high; the long end rallies as the front end prices more tightening. |
| US_2Y | N | 4.82% sits 107bp over 3.75% fed funds; hikes are priced, so we neither chase nor fade the front end. |
| LQD | N | +0.9% WoW on duration but -6.2% YTD; we take rate exposure through Treasuries instead. |
| HYG | UW | 77.06 is $0.25 above its 76.81 low; AI-capex funding stress hits the weakest borrowers first. |
| SPY | N | 0.9% below its 779.09 high; index calm masks a -3.7% QQQ versus +1.5% DIA rotation. |
| QQQ | UW | -3.7% WoW as a 4.82% 2Y lifts the AI capex hurdle; +18.0% YTD leaves room to de-rate. |
| DIA | OW | +1.5% WoW; cash-generative value gains as the discount rate punishes long-duration growth. |
| EURUSD | N | 1.1193 is six pips above the 52w low; carry favours USD but the oversold reading caps downside. |
| DXY | N | 121.60 is 0.3% below its 52w high; front-end carry supports it while crowding limits upside. |
| BTC | N | -2.2% WoW to 81,865.1; $17.3M top-PnL WBTC buying offsets weaker Hyperliquid positioning. |
| ETH | N | $399.3M exchange outflow against a net-short Hyperliquid cohort; spot and perps cancel out. |
| GLD | N | -4.1% YTD with a 5.19% 10Y raising carry cost; no catalyst before the late-October FOMC. |
On-Chain Pulse
Seven-day on-chain data for 9 to 16 October shows a split cohort: spot holders accumulated ETH and wrapped BTC while SOL moved onto exchanges, and Hyperliquid smart-money positioning turned more negative across all five majors. The derivatives read is directional only, because our package carries no Hyperliquid dollar sizes, funding rates or open-interest levels, and we do not fill those gaps with estimates. Total crypto market capitalisation stands at $2.89T, +2.84% over 24 hours on $497.26B of volume, so the late-week spot bounce has not yet changed the weekly cohort lean. XRP and BNB are omitted because the package carries no asset-level flow detail for them.
Bitcoin coverage is WBTC on Ethereum, a proxy rather than native network flow, and we size our conclusions accordingly. Smart traders were net buyers of +$49.9k over seven days, a token amount, while top-PnL wallets, the closest proxy we have to a whale cohort, added +$17.3M, roughly 347 times the smart-trader figure. Exchange balances fell by a $35M net outflow, running at 2.1 times the average pace, which points to holders withdrawing coins rather than preparing to sell. On Hyperliquid, smart-money positioning shifted negatively, so the derivatives cohort leaned against the spot accumulation; the package gives no BTC funding rate or open-interest level. That spot-versus-perps divergence is the signal we weight, since patient capital is absorbing supply while short-horizon leverage de-risks alongside the Nasdaq. We hold BTC at neutral: accumulation near 81,865.1 limits the downside, but a 2Y at 4.82% caps the leverage that would carry price through the 86,599.2 high.
Ethereum carries the largest spot signal of the week. Smart traders were net buyers of +$552.8k and top-PnL wallets added +$188.8M, roughly 342 times the smart-trader flow and the heaviest large-wallet accumulation across the majors. Exchanges recorded a $399.3M net outflow at 1.2 times the average, though entity activity was mixed, with staking withdrawals, exchange deposits and DEX selling running alongside the withdrawals. Against that spot strength, the Hyperliquid smart-money cohort ended the window net short ETH, the clearest perps-versus-spot divergence in the data; no funding rate or open-interest figure is available in our package. A net-short perps book against $399.3M leaving exchanges sets up squeeze risk if risk appetite turns, but it also says informed short-horizon traders expect the -3.1% weekly slide to extend. We stay neutral on ETH, because the spot bid argues against an underweight while a -18.2% YTD trend and a net-short derivatives cohort argue against adding.
Solana shows the cleanest bearish alignment of the three. Smart traders were net sellers of -$334.6k and top-PnL wallets sold -$6M, about 18 times the smart-trader figure, so both cohorts point the same way. Exchanges took in a $231.8M net inflow, running at 2.0 times the average, which is supply moving into position for sale rather than into custody. On Hyperliquid, the largest single shift across the five majors was reduced smart-money long exposure in SOL; funding and open-interest levels are not in our data set. Spot and perps agree here, which removes the divergence that keeps us neutral on BTC and ETH. We are underweight SOL, which fell -5.5% WoW to 105.197 and sits -17.1% YTD, and we would revisit only if exchange flows flip to net outflows while price recovers toward its 122.109 52-week high.
What We're Watching
We would cut duration to neutral if the 10Y closes above its 5.31% 52-week high while the 2Y holds below 4.92%, which would mark a term-premium shock rather than a growth signal. We would extend the high-yield underweight and trim IWM if HYG breaks its 76.81 52-week low. We would cover the QQQ underweight if it reclaims its 759.66 high with the 2Y below 4.92%. We would move EUR/USD to underweight on a weekly close below 1.1187. The 27-28 October FOMC is the event that tests front-end pricing. Crude views stay at neutral until our primary and cross-check Brent feeds reconcile, given the 18.45% divergence between them.
This Week in Charts