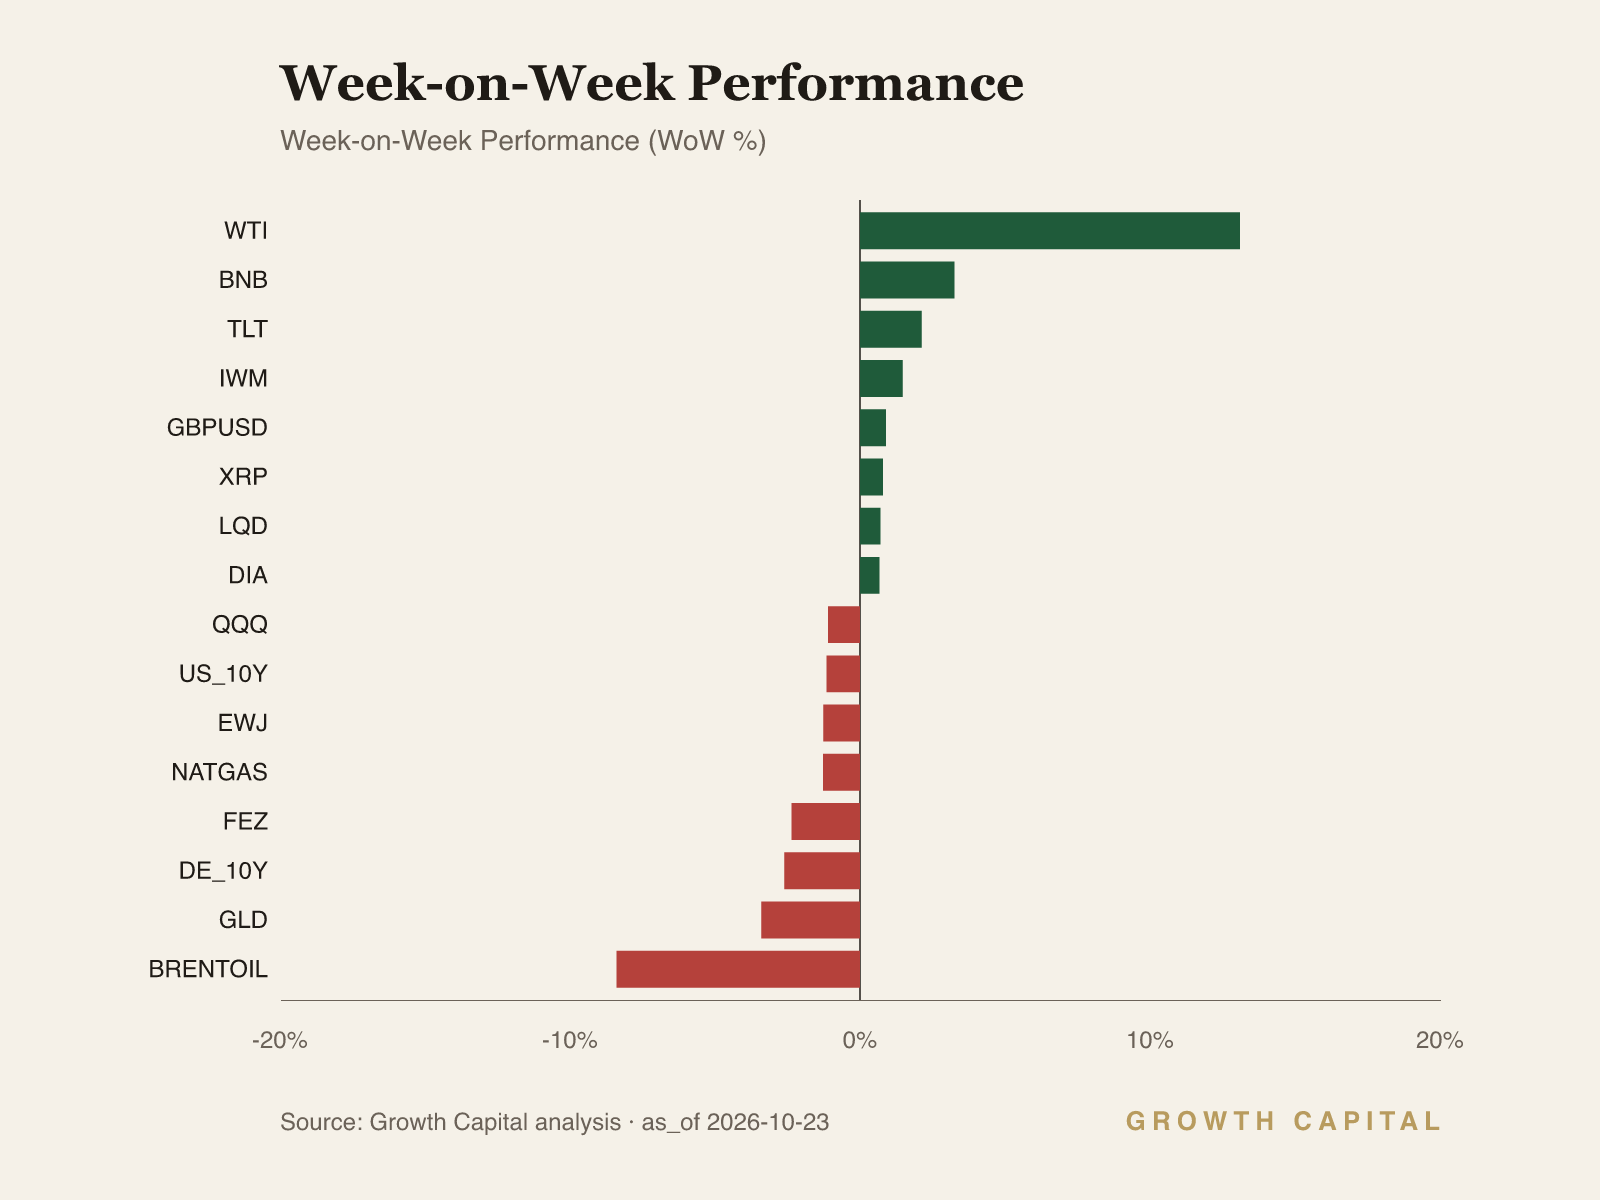
The curve is bull-flattening into a stagflation lean. The 10Y fell -1.2% WoW in yield terms to 5.13% while the 2Y held at 4.81%, a 32bp positive slope.
Equity leadership is rotating away from duration while credit sits near its lows. QQQ fell -1.1% and FEZ -2.4% as IWM gained +1.5%, and HYG at 76.96 sits 15 cents above its 76.81 52-week low.
Gold failed as a hedge because front-end fear dominated. GLD fell -3.4% WoW to 369.01 in a week when the 10Y yield declined, leaving it 1.8% above its 362.32 low.
Our positioning: The front end is pinned and the long end is pricing growth damage; we own duration and stay underweight high yield.
A pinned front end and a rallying long end argue for duration over credit
Our house read is a stagflation lean expressed through a bull-flattening curve: the long end has begun to price growth damage while the front end stays pinned by inflation risk. The US 10Y closed at 5.13%, -1.2% WoW in yield terms and 18bp below its 5.31% 52-week high, while the 2Y at 4.81% moved only -0.2%. That asymmetry says the market has stopped extending the tightening path without yet pricing relief. Equity leadership tells the same story, with QQQ -1.1% and FEZ -2.4% against IWM +1.5% and DIA +0.7%. Gold did not act as a hedge, with GLD -3.4% WoW, which is how a market behaves when it fears higher policy rates more than slower growth. We place the cycle late: the September tightening and a 4.2% unemployment rate leave the Fed little room to ease into an energy shock. Our draft tilt for CIO review is overweight duration at the 10-year point, neutral equity beta and underweight high yield.
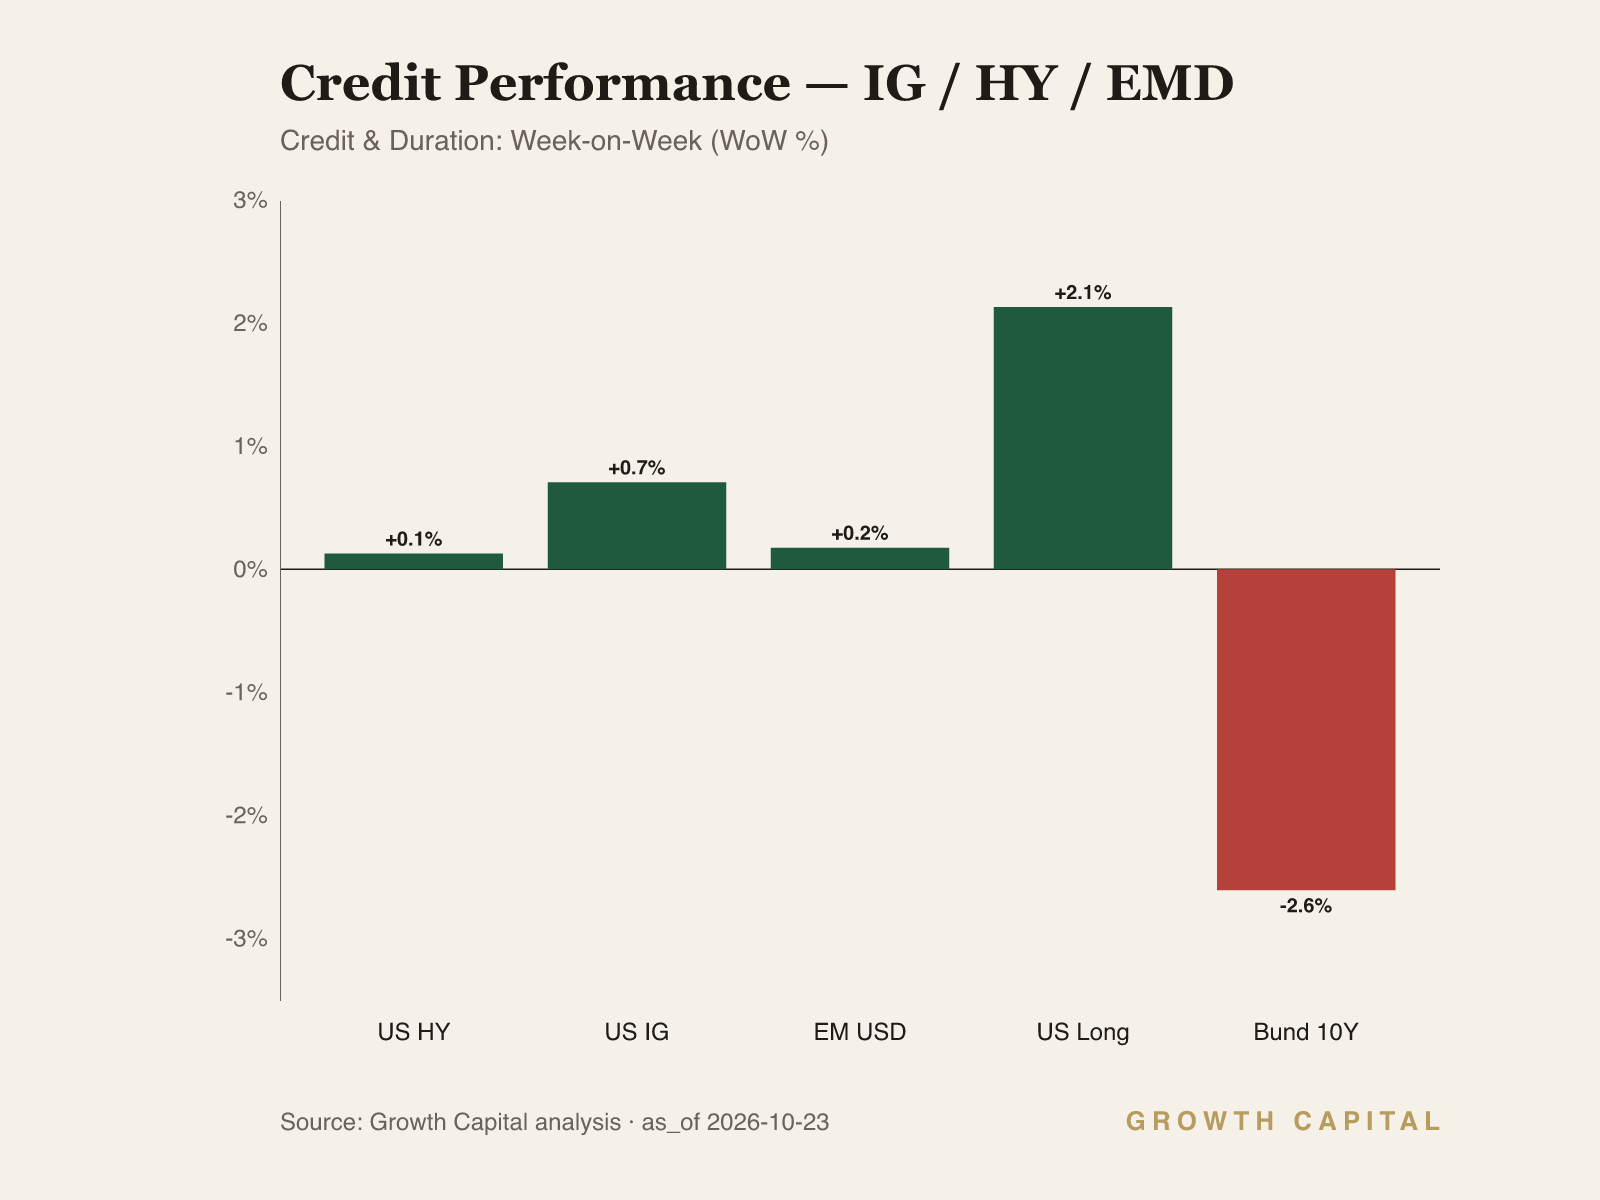
The 10Y at 5.13% versus the 2Y at 4.81% leaves a 32bp positive slope, and this week the 10Y yield moved -1.2% against -0.2% for the 2Y while TLT gained +2.1% to 81.75. The Bund joined the rally, with the German 10Y at 3.36%, -2.6% WoW and 30bp below its 3.66% high, so the long-end bid is global. The transmission runs from policy to term premium. The 2Y at 4.81% sits 106bp above the 3.75% fed funds rate, so the front end already discounts further tightening and has little left to reprice when an energy shock lifts headline inflation. With that leg anchored, incremental growth fear routes into the long end: weaker equity cash flows and softer European activity lower the expected path of short rates beyond two years, term premium compresses, and the 10Y falls faster than the 2Y, which is the bull flattening on our screens. We are overweight duration at the 10-year point, expressed through TLT, on a three-to-six-month horizon, because 5.13% pays 138bp over the 3.75% policy rate while we wait for the growth signal to mature. The trade-off we accept is mark-to-market pain if the energy impulse forces another hike, and TLT at -6.1% YTD shows how costly that scenario has already been. We would cut to neutral if the 10Y breaks above its 5.31% 52-week high while the 2Y clears its 4.92% high; that combination would signal a higher terminal rate, and the long end would then be carrying policy risk instead of growth risk.
The equity and credit tape confirms the regime read, with one apparent contradiction that the numbers resolve. SPY closed at 759.58, -0.5% WoW and 2.5% below its 779.09 high, while QQQ fell -1.1% to 701.95, 7.6% below its 759.66 high, and HYG at 76.96 sits 15 cents above its 76.81 52-week low after a +0.1% week. The channel runs from rates to duration to multiples. Growth equity discounts cash flows furthest into the future, so a 10Y at 5.13% compresses its multiple more than it compresses value or cyclical equity, which is why QQQ lagged DIA at +0.7% and IWM at +1.5% in a week when yields fell. Credit carries the second link: LQD at 104.13 is still -5.5% YTD and HYG -4.6% YTD because the marginal borrower refinances off a 2Y at 4.81%, so the long-end rally passes almost nothing through to high-yield funding costs. The contradiction is IWM +1.5%, which looks risk-on, but at 274.42 it remains 10.1% below its 305.09 high, so we read the move as rotation out of crowded mega-cap duration and not a broad re-rating. We hold neutral SPY, underweight QQQ and underweight HYG on a three-month horizon, accepting that a rebound in AI-linked earnings would leave us behind the Nasdaq-100. If HYG closes below its 76.81 low we would cut equity beta to underweight, because a credit break there would show refinancing stress reaching the equity layer; a QQQ recovery through its 759.66 high would instead show multiples absorbing a 5.13% 10Y and would end our underweight.
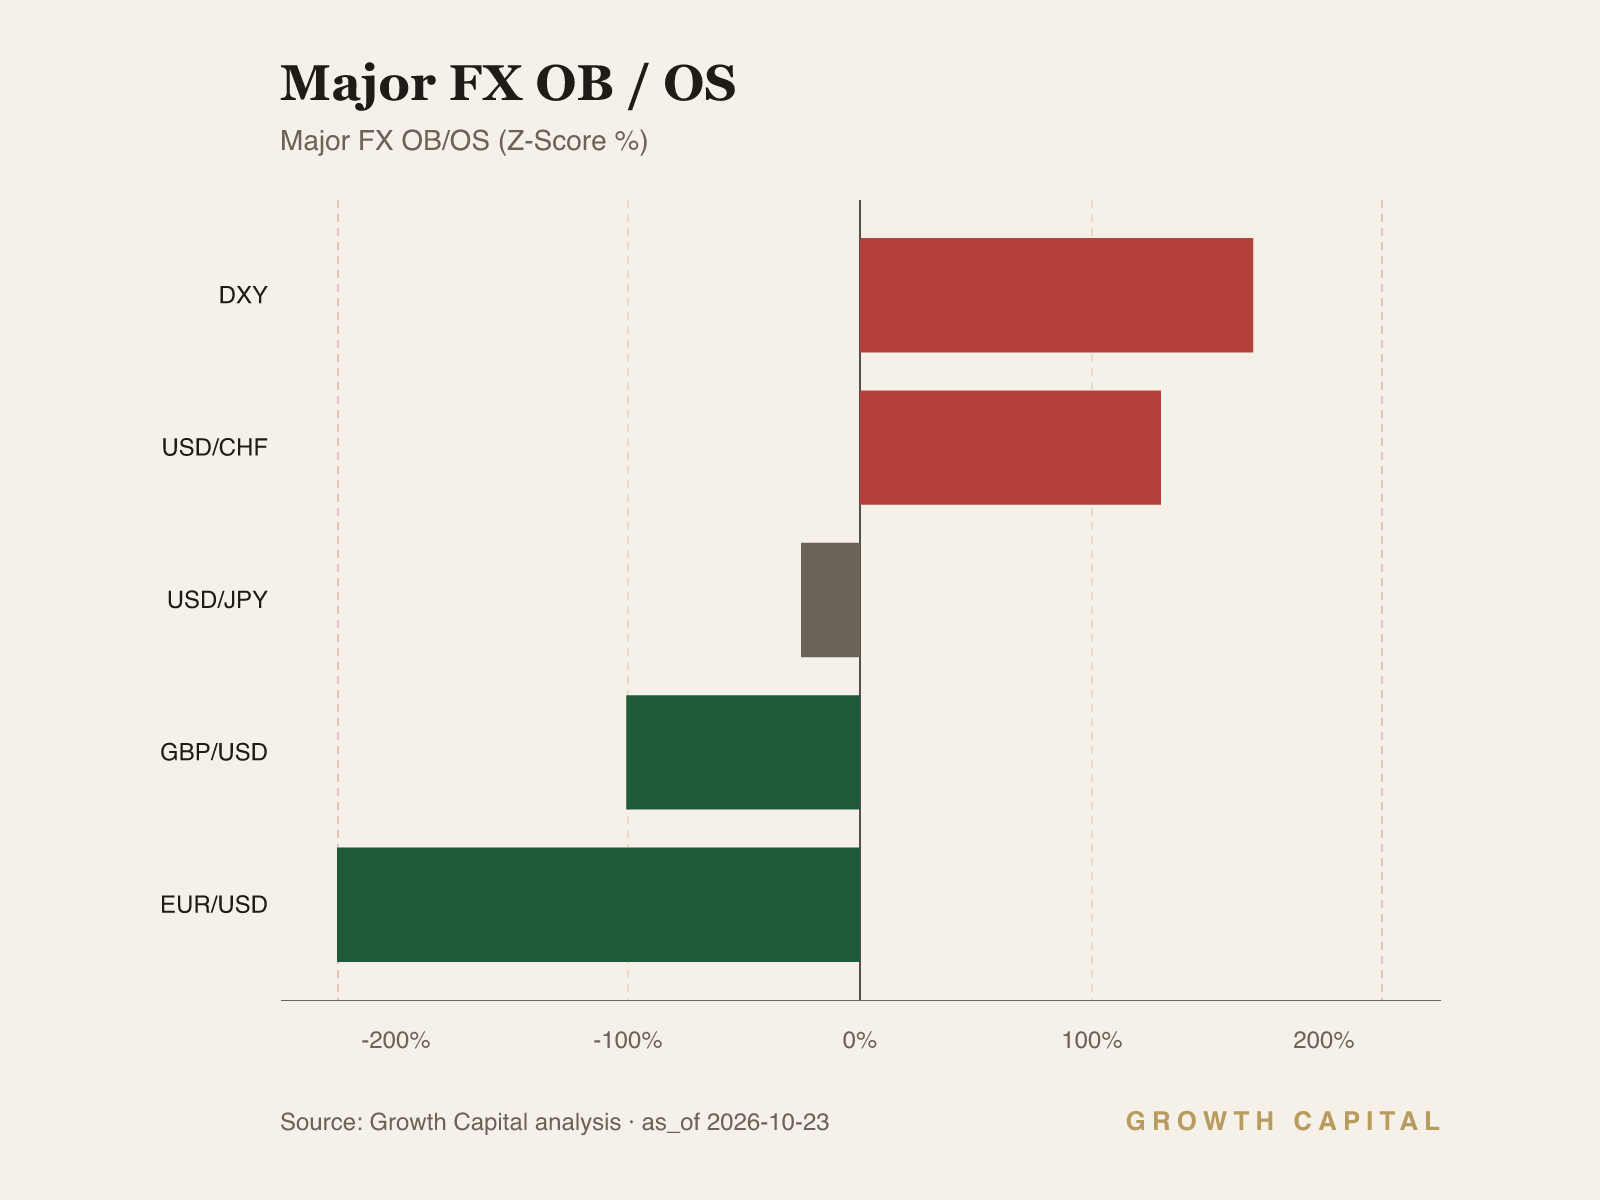
The dollar rail is the second-most-material read, and it coheres with the stagflation lean. DXY at 121.40 is flat on the week at -0.03% and 0.5% below its 122.00 52-week high, while EUR/USD at 1.1231 gained +0.3% WoW but is -4.3% YTD and only 1.0% above its 1.1123 low. The 10Y at 5.13% versus the Bund at 3.36% is a 177bp gap, and that carry keeps real money paid to hold dollars even as US long yields fall. Europe absorbs the energy terms-of-trade hit first, which FEZ at -2.4% WoW and -1.6% YTD confirms. USD/CHF fell -1.1% to 0.8243 and USD/JPY -0.2% to 158.00, a modest safe-haven bid that fits the risk-off tilt in our regime read. We are underweight EUR/USD and would move to neutral only on a reclaim of its 1.1980 52-week high, which would show the rate gap no longer sets the price.
What would change our view is a named print: a 10Y close above its 5.31% high with the 2Y through its 4.92% high would show a higher terminal rate being priced and would end our duration overweight. The falsifiable downside is an energy-led inflation surprise into next week's FOMC meeting that lifts the 2Y through 4.92%, in which case we expect TLT to retest its 77.11 low and would cut credit and equity risk on a HYG break below 76.81. The falsifiable upside is a contained growth scare: if QQQ retakes its 759.66 high while the 10Y holds at or below 5.13%, multiples are absorbing current yields and we would lift equity beta to overweight. A GLD break below its 362.32 low would move gold to underweight. We anchor nothing on energy levels, because the Brent primary feed at $115.22/bbl diverges from the crosscheck at $110.65/bbl beyond tolerance, and that cross-source caveat keeps Brent at neutral.
Source: GrowthCapital analysis; market data from the weekly snapshot (FRED, exchange ETF pricing); on-chain data from Nansen and Hyperliquid.
Fixed Income
We are overweight duration and underweight high yield, and one mechanism drives both calls. The US 10Y at 5.13% fell -1.2% WoW in yield terms while the 2Y at 4.81% moved -0.2%, and the curve holds a 32bp positive slope (5.13% versus 4.81%). TLT gained +2.1% to 81.75, yet it remains -6.1% YTD and only 6.0% above its 77.11 low, so the long end still carries a full year of repricing. The mechanism is a pinned front end. The 2Y trades 106bp above the 3.75% fed funds rate (4.81% versus 3.75%), so further tightening is already in the price, and incremental growth fear has one outlet: term premium further out the curve. Coupon income also matters at these levels, because a 5.13% yield absorbs a larger adverse price move before total return turns negative than the same position did at the 3.97% 52-week low. Credit does not share the relief. LQD at 104.13 gained +0.7% WoW but is -5.5% YTD, and HYG at 76.96 rose only +0.1% and sits 15 cents above its 76.81 52-week low, flagged slightly oversold. High-yield issuers refinance off the front end, and a 4.81% 2Y sits only 11bp below its 4.92% high, so the marginal borrower's funding cost stays near its cycle peak. Our draft view is OW duration via TLT, N on the 2Y and UW HYG over three to six months, accepting mark-to-market losses if an energy-led inflation print forces another hike. We would exit the duration overweight on a 10Y close above 5.31%, and cover the HYG underweight only on a recovery above its 81.28 52-week high, which would show refinancing stress has cleared.
Equities
We are neutral on SPY and underweight QQQ, and the week's rotation is the evidence that the market is repricing duration risk inside equities. SPY closed at 759.58, -0.5% WoW and +11.2% YTD, while QQQ fell -1.1% to 701.95 and DIA and IWM gained +0.7% and +1.5%. Outside the US, FEZ fell -2.4% and EWJ -1.3%, so the de-rating of growth exposure was global. The transmission runs from the discount rate to multiples. The Nasdaq-100 holds the longest-duration earnings streams and the heaviest AI capital spending, a growing share of it debt-funded, so a 10Y at 5.13% bites hardest there; QQQ sits 7.6% below its 759.66 high against 2.5% for SPY versus its 779.09 high. The bid for IWM, at 274.42 and still 10.1% below its 305.09 high, is relief buying in lower-multiple names. We do not read it as a growth vote, because small caps carry more floating-rate debt priced off a 4.81% 2Y. The breadth commentary we track points the same way, with index gains arriving alongside more decliners than advancers. Our draft view is N SPY, UW QQQ and N IWM over three months, with a preference for cash-generative quality inside the S&P 500. The trade-off is plain: if AI-linked earnings re-accelerate, the underweight costs relative performance against a QQQ that is still +14.5% YTD. We would close the QQQ underweight on a recovery through 759.66 with the 10Y at or below 5.13%, and cut SPY to underweight if HYG breaks its 76.81 low, which would show credit stress reaching equity.
Commodities
We are neutral on gold after a week in which it failed as a hedge. GLD fell -3.4% WoW to 369.01, is -7.3% YTD, and sits 1.8% above its 362.32 52-week low and 25.6% below its 495.90 high. The decline came in a week when the 10Y yield fell, so long-end real rates cannot explain it. The mechanism runs through the front end. Gold's opportunity cost is the cash yield an investor expects to earn over the holding period, and with the 2Y at 4.81% sitting 106bp above the 3.75% fed funds rate, the market is pricing a higher policy path in response to the energy shock. A higher expected cash yield raises the cost of holding a non-yielding asset, and when crowded commodity length is cut, gold is the most liquid position to sell. The dollar adds pressure, with DXY at 121.40 only 0.5% below its 122.00 high. Energy itself fails our reconciliation test, so we hold Brent at neutral: the Brent primary feed at $115.22/bbl diverges from the crosscheck at $110.65/bbl, and the WTI primary at $107.89/bbl diverges from $101.80/bbl, both beyond tolerance, so we take no directional energy call from this data. Our draft view is N GLD over three months, accepting that we miss a sharp rebound if next week's FOMC signals a pause. A GLD break below 362.32 would move us to underweight, confirming that policy-rate repricing has further to run; a rally with DXY falling back toward its 117.44 low would move us to overweight, because gold would again be trading the dollar and growth instead of the front end.
Digital Assets
We are neutral on BTC and underweight ETH, a quality call inside a liquidity-sensitive asset class. BTC closed at 81,780.10, -0.4% WoW and -7.9% YTD, 5.6% below its 86,599.20 high, while ETH at 2,403.89 was -0.2% WoW and -20.0% YTD. BTC dominance stands at 57.37% of a $2.86T total crypto market, which moved -0.03% over 24 hours on $175.5B of volume. The transmission runs from the policy rate to the opportunity cost of holding zero-yield risk assets. With the 2Y at 4.81% and the fed funds rate at 3.75%, cash pays enough that marginal crypto demand has to come from conviction buyers, and those buyers concentrate in the most liquid collateral first. That is why the gap between ETH at -20.0% YTD and BTC at -7.9% YTD has widened in a tightening year, and why dominance at 57.37% holds in a flat week. BNB at +3.3% WoW and SOL at +0.4% look like rotation, but both remain negative YTD at -13.5% and -17.6%. The on-chain detail in the pulse below supports the split, with profitable derivatives traders leaning long BTC and short ETH. Our draft view is N BTC and UW ETH over three months, accepting that a broad liquidity rally would lift ETH faster than BTC. We would move BTC to overweight on a break above 86,599.20 with dominance at or above 57.37%, and close the ETH underweight on a reclaim of its 2,775.05 52-week high.
GC Views
| Asset | View | Rationale |
|---|---|---|
| US_10Y | OW | OW duration: 5.13% pays 138bp over 3.75% fed funds and sits 18bp below the 5.31% high. |
| US_2Y | N | 4.81% is 106bp over 3.75% funds; hikes priced, little room to rally while energy lifts inflation. |
| TLT | OW | +2.1% WoW to 81.75 but -6.1% YTD; 5.13% long-end carry pays to wait for the growth signal. |
| HYG | UW | 76.96 is 15 cents above the 76.81 low; issuers refinance off a 4.81% 2Y, not the long end. |
| SPY | N | 759.58 is 2.5% below the 779.09 high; rotation holds the index but breadth is thin. |
| QQQ | UW | -1.1% WoW and 7.6% below its 759.66 high; longest-duration multiple most exposed to a 5.13% 10Y. |
| IWM | N | +1.5% WoW but 10.1% below the 305.09 high; relief rotation, floating-rate debt priced off 4.81%. |
| GLD | N | -3.4% WoW to 369.01 as front-end fear beat growth fear; 1.8% above the 362.32 low. |
| BTC | N | 81,780.10 is 5.6% below the 86,599.20 high; 57.37% dominance shows a quality bid, no breakout. |
| ETH | UW | -20.0% YTD versus BTC -7.9%; profitable-wallet and derivatives cohorts lean short. |
| EURUSD | UW | 177bp UST-Bund gap (5.13% vs 3.36%) favours USD; 1.1231 sits 1.0% above the 1.1123 low. |
On-Chain Pulse
The cross-asset pattern this week is a mixed cohort lean: profitable traders show the strongest positive derivatives shift in BTC, lean bearish on ETH despite heavy exchange outflows, and accumulate BNB into a very large exchange inflow. Coverage shapes what we can say. Smart Money means Nansen-labelled profitable traders and funds, derivatives data covers Hyperliquid only, BTC spot is read through wrapped tokens, and the extract carries no whale-cohort split, funding rate or open-interest level for any asset, so we state those gaps instead of filling them; native XRP Ledger flows sit outside coverage and SOL carries no material on-chain signal, so neither gets a paragraph.
Bitcoin carries the strongest positive Smart Money derivatives shift among the five majors on Hyperliquid over the 16-23 October window, the most constructive signal in the set. On Wrapped Bitcoin on Ethereum, Smart Traders were net +$7.2k and Top PnL wallets +$11.7M, while on Coinbase's cbBTC on Base, Smart Traders were -$7.3k and Top PnL wallets -$6.2M, a combined top-PnL lean of +$5.5M (+$11.7M against -$6.2M). The extract gives no whale net position or whale-to-smart-trader exposure ratio for BTC, and we do not infer one. The spot-versus-wrapper divergence is the clearest flow signal: Wrapped Bitcoin saw a $16.4M exchange outflow while cbBTC took an $11.1M inflow, and US spot BTC ETFs lost $635M on 23 October after a three-day $1.08B inflow streak, leaving the week +$443M and October -$175M. No funding rate or open-interest level is carried, so the derivatives read is directional only. Our implication is neutral BTC: derivatives traders lead the spot tape constructively, but ETF outflows of that size argue against adding before price clears the 86,599.20 high.
Ethereum shows the sharpest divergence in the set: a $450.3M net exchange outflow, running at 1.1x the average, against bearish Smart Money positioning in Hyperliquid derivatives. Spot Smart Traders were a marginal +$174.5k while Top PnL wallets were net -$11.1M, so the profitable cohort sold into the outflow. The extract carries no whale net position or whale-to-smart-trader exposure ratio for ETH, and we leave that field empty. Coins leaving exchanges usually tighten available supply, and staking at 44M ETH, 36% of supply, extends that lock-up, but ether ETFs still posted roughly $111M of outflows. No funding rate or open-interest level is available, so we read derivatives direction only. Our implication is underweight ETH: when the most profitable wallets and the derivatives cohort lean short against a supply squeeze, we side with the traders until price reclaims the 2,775.05 high.
BNB carries the largest single flow in the window, a $632.5M net exchange inflow that the data flags as unusually large. That inflow arrived alongside accumulation by profitable traders, but the extract gives no dollar size for that accumulation, and no whale net position or exposure ratio. Price confirms the buying in the short run, with BNB +3.3% WoW at 746.65, though it remains -13.5% YTD and 6.6% below its 799.16 high. Coins moving onto exchanges at that scale usually mean supply available to sell, so the divergence between the inflow and the profitable-trader bid is the key tension. No funding rate or open-interest level is carried for BNB on Hyperliquid in this extract. BNB sits outside our view table, and we would not chase the +3.3% week: until the $632.5M inflow is absorbed without a price break, we treat it as distribution risk.
What We're Watching
Our falsifiers carry named thresholds. A 10Y close above its 5.31% 52-week high with the 2Y through its 4.92% high ends our duration overweight, because it would mean a higher terminal rate is being priced. A HYG close below its 76.81 low cuts equity beta to underweight. A QQQ recovery through its 759.66 high with the 10Y at or below 5.13% lifts equity beta to overweight. EUR/USD reclaiming its 1.1980 high ends our euro underweight. A GLD break below 362.32 moves gold to underweight. BTC above 86,599.20 with dominance at or above 57.37% moves BTC to overweight. Next week's FOMC statement is the catalyst for the front-end leg of every one of these tests.
This Week in Charts