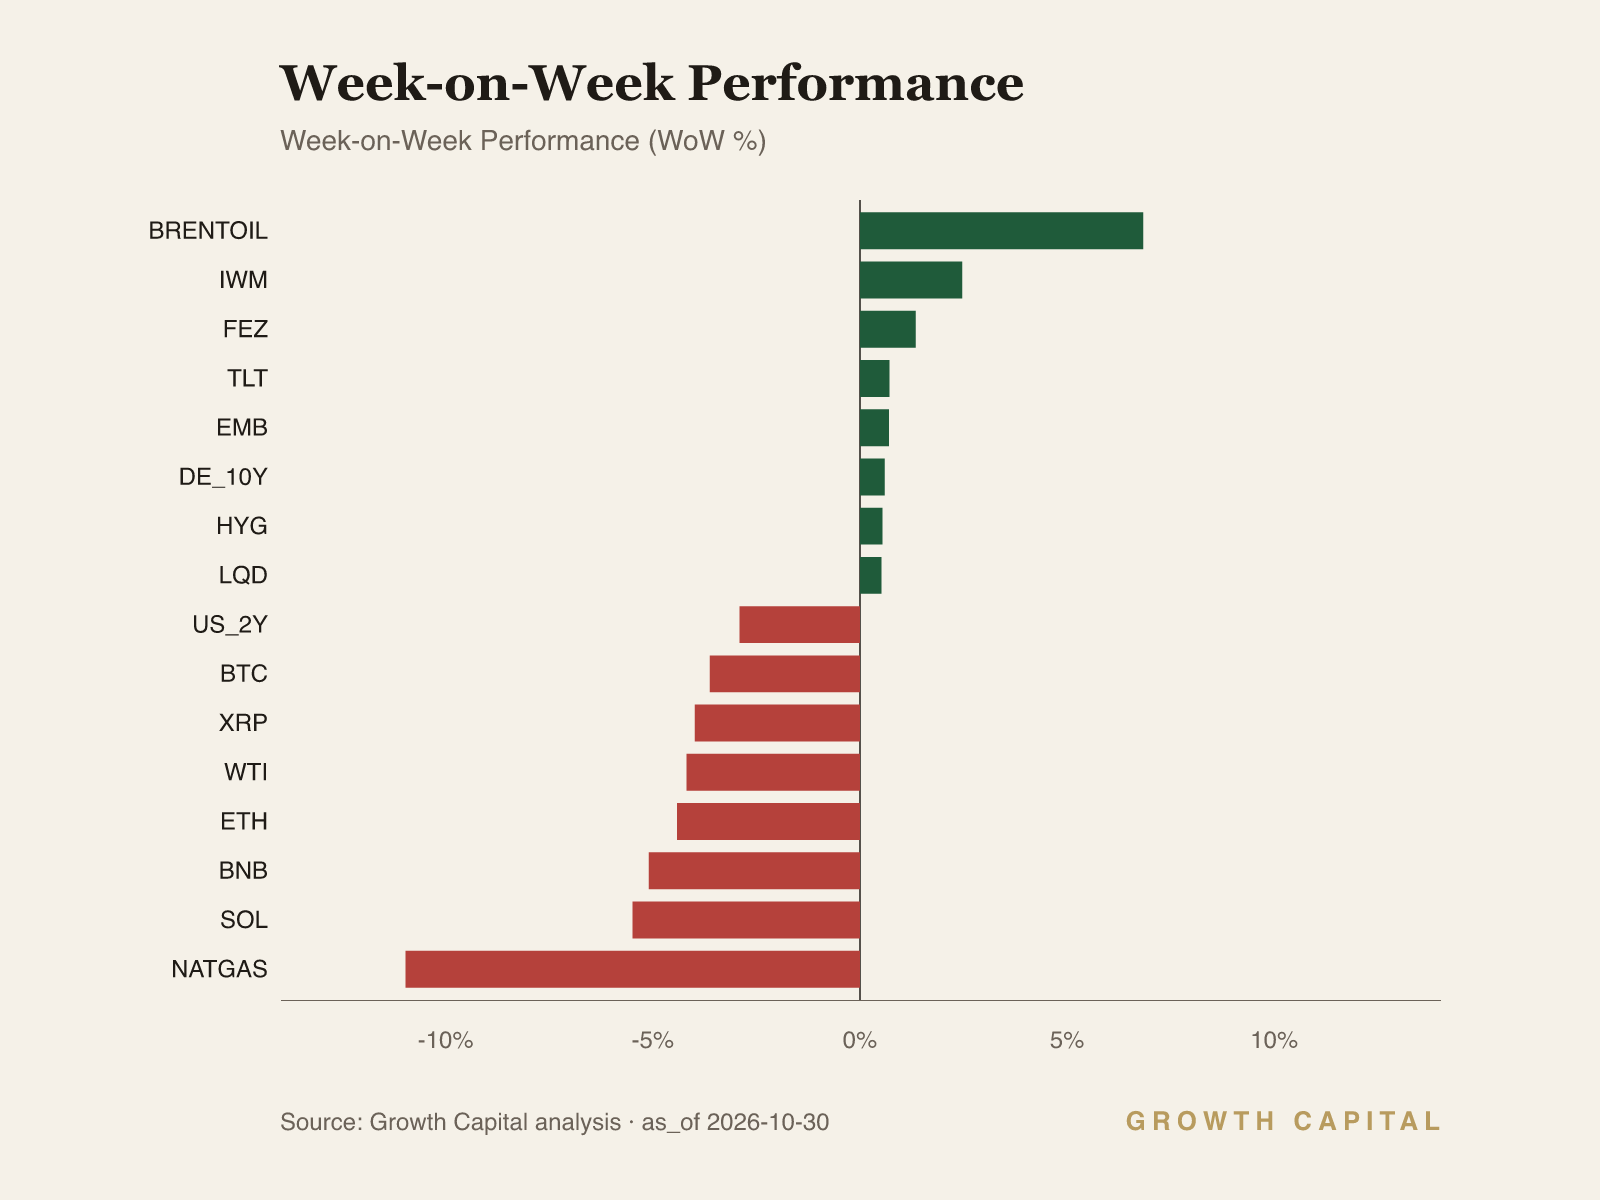
This is a hawkish hold, not a pivot. The 2Y at 4.67% sits 92bp above the 3.75% fed funds reading, so the market still prices tightening even after a -2.9% WoW fall in the 2Y yield.
Credit contradicts the equity tape, and we side with credit. SPY is +11.2% YTD while HYG is -4.0% YTD at 77.47, only 0.9% above its 52-week low of 76.81.
Real-rate carry is draining non-yielding assets. GLD closed at its 52-week low of 360.26, -9.5% YTD, while BTC fell -3.6% WoW to $77,216.8.
Our positioning: The front end already prices the hikes the Fed declined to deliver; we own the 2Y over the 10Y and underweight long duration.
The 2Y sits 92bp above the policy rate, and credit is pricing it before equities
Our regime read for the week ending 30 October 2026 is a hawkish hold with a credit warning. The Federal Reserve left policy unchanged with the fed funds reading at 3.75%, yet the 2Y Treasury yield closed at 4.67%, 92bp above it, so the market still prices tightening the committee declined to deliver. That gap survived a week in which the 2Y fell -2.9% and the 10Y fell -1.6% to 5.05%, which tells us the rally squared positions inside an unchanged policy path. Growth gives the committee no reason to ease, with the advance GDP reading at 3.4% and unemployment at 4.2%. An energy supply shock layered on that growth keeps inflation risk skewed higher, and dissents in favour of a hike show a reaction function leaning toward tightening. Equities have not accepted this read, with SPY flat on the week and +11.2% YTD. Credit has, and we side with credit.
The 10Y at 5.05% versus the 2Y at 4.67% leaves a 38bp curve, and the front end has risen 34.6% YTD against 20.5% for the 10Y in relative terms. The 10Y sits 26bp below its 52-week high of 5.31%, while TLT gained +0.7% on the week yet remains -5.9% YTD. The transmission runs from the policy reaction function to the front end and then into term premium at the long end. With the 2Y 92bp above the 3.75% policy rate, the front end already discounts several tightening steps, so each hawkish signal moves it less, while an energy-led inflation impulse raises the compensation investors demand to hold 10-year paper. The long end also carries a funding channel: repo-financed basis positions sell into rising volatility, so the 10Y trades on dealer balance-sheet capacity as well as on the policy path, which is how it reached 5.31% without a change in the policy rate. We are underweight long duration and overweight the front end, with the 2Y earning 92bp over the policy rate at far lower term-premium exposure than the 10Y. The trade-off over a three-to-six-month horizon is explicit: if growth cracks, the 10Y rallies harder than the 2Y and we surrender that convexity for carry. We would invert to overweight duration if the 2Y breaks below the 3.75% policy rate, the point where the market prices cuts; that print would signal a reaction function turning from inflation control to growth protection.
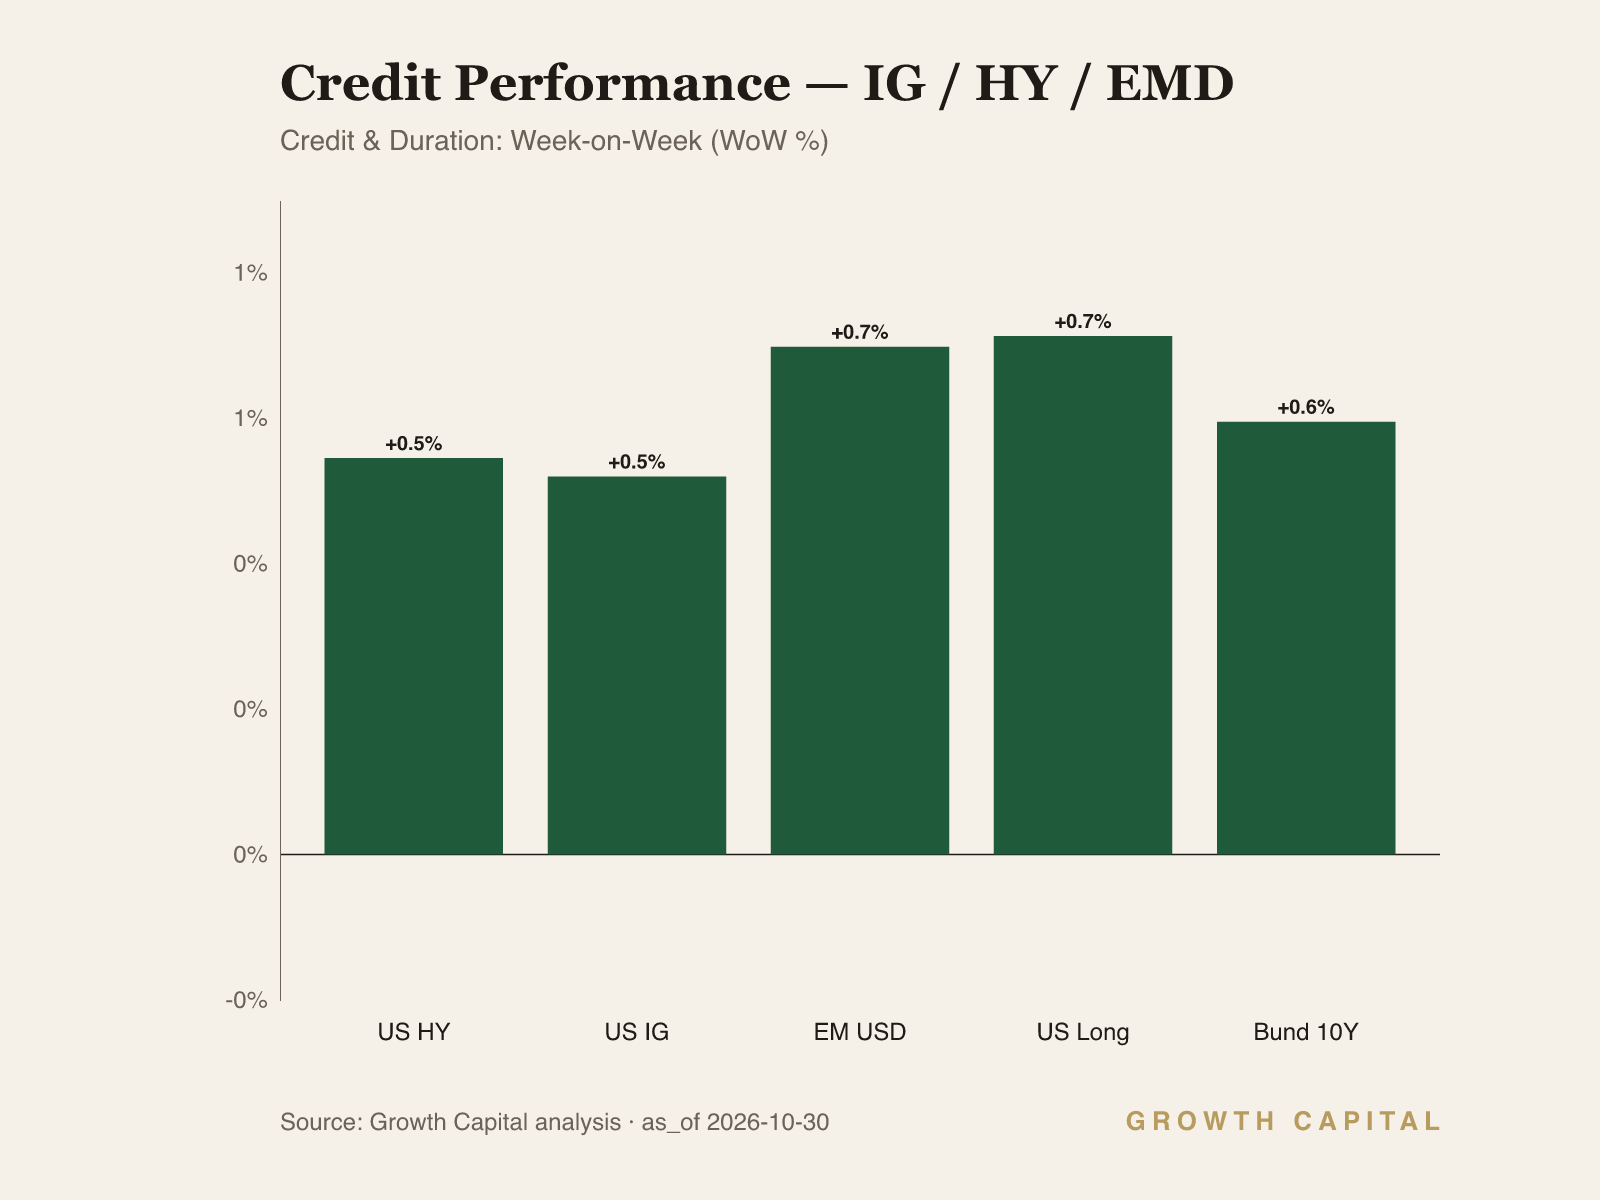
The equity tape contradicts our regime read at the index level and confirms it beneath the surface: SPY closed at 759.99, 2.5% below its 52-week high of 779.09, but QQQ fell -1.4% WoW while IWM rose +2.5%. Credit confirms the hawkish read outright, as HYG at 77.47 trades 0.9% above its 52-week low of 76.81 and LQD is -5.2% YTD despite a +0.5% week. The channel is rates to discount rates to multiples, and it bites hardest on the longest-duration equity cash flows. A 10Y at 5.05% raises the hurdle on megacap technology valuations, whose earnings arrive furthest in the future, and AI capital spending financed increasingly with long-dated debt adds a credit leg to that pressure. High yield transmits the same force through refinancing at yields built on a 5.05% base, so spreads absorb the policy path before earnings revisions do; the 15.2pp gap between SPY at +11.2% YTD and HYG at -4.0% YTD measures how far equities have run ahead of their financing costs. We hold SPY at neutral and underweight QQQ, accepting that we lag over the next quarter if megacap guidance re-accelerates. We read the IWM bounce as front-end relief for floating-rate borrowers after the 2Y fell -2.9%, and we do not chase it while its trend signal is down. We would move SPY to overweight if HYG reclaims its 52-week high of 81.18 while the 10Y holds below 5.05%; that combination would show the credit channel releasing its grip on equity multiples.
FX is the second-most material rail, and it confirms the hawkish-hold read through rate differentials. EUR/USD at 1.1199 is -4.6% YTD and sits 0.7% above its 52-week low of 1.1123, with the 10Y at 5.05% versus the Bund at 3.38%, a 167bp gap that rewards dollar carry. The euro area imports energy, so the supply shock worsens its terms of trade while the rate gap stays wide, and an ECB on hold does not offset that drag. The broad dollar index was -0.1% WoW and +1.4% YTD, and USD/JPY eased -0.7% to 156.87 after the BOJ's hawkish tilt, so dollar strength is concentrated against the euro. We are underweight EUR/USD, consistent with the risk-off undertone in our regime call. A close below 1.1123 extends the call, while a Bund move above its 52-week high of 3.66% that narrows the gap would take us to neutral.
What would change our view is a 10Y close above its 52-week high of 5.31%, which would move us from hawkish hold to term-premium break and lead us to cut equity beta further. The falsifiable downside pairs that breach with HYG closing below its 52-week low of 76.81, a sign of refinancing stress spreading into equity earnings, and we would then move SPY to underweight. The falsifiable upside is the 2Y falling toward the 3.75% policy rate while HYG retakes its 52-week high of 81.18, which would validate the equity tape and lead us to add SPY. Our energy read stays qualitative: Brent primary and cross-check feeds diverge beyond tolerance, and WTI at $103.37/bbl, -4.2% WoW, carries a 0.5% cross-source divergence, so we treat crude as directionally inflationary without anchoring a threshold to it. These positions are a draft for CIO review.
Source: GrowthCapital analysis; market data per snapshot (FRED, ETF and FX pricing); Federal Reserve and ECB policy statements.
Fixed Income
Our duration call is underweight the long end and overweight the front end. The 10Y yield is 5.05%, -1.6% WoW and +20.5% YTD in relative terms, 26bp below its 52-week high of 5.31% and well above its 52-week low of 3.97%. The 2Y at 4.67% fell -2.9% WoW but remains 92bp above the 3.75% fed funds reading, so the market still discounts tightening after a split hold. The mechanism works in two stages. First, the policy reaction function anchors the front end: with growth at 3.4% and unemployment at 4.2%, the committee has no reason to cut, and 2Y yields already price the hikes it might deliver. Second, energy-driven inflation uncertainty lifts term premium at the long end, and repo-financed basis positions amplify selling when volatility rises, so the 10Y carries risks the 2Y does not. Credit confirms the read. HYG is -4.0% YTD at 77.47, only 0.9% above its 52-week low of 76.81, and LQD is -5.2% YTD, which tells us refinancing costs are moving into spreads ahead of defaults. Our positioning over a three-to-six-month horizon is to prefer 2Y carry, underweight 10Y duration and underweight HYG. We accept that a growth shock would rally the long end harder than the front end and cost us convexity. We would reverse to overweight duration if the 2Y breaks below the 3.75% policy rate, which would signal the market moving from pricing hikes to pricing cuts. A HYG close below 76.81 would deepen our credit underweight, while a HYG recovery to its 52-week high of 81.18 would take us back to neutral on high yield.
Equities
We are neutral SPY, underweight QQQ and neutral IWM. SPY closed at 759.99, flat on the week and +11.2% YTD, 2.5% below its 52-week high of 779.09. Beneath the index the rotation is sharp: QQQ fell -1.4% WoW to 694.61, 8.6% below its 52-week high of 759.66, while IWM rose +2.5% to 282.56. The transmission runs from the 10Y at 5.05% into the discount rate applied to long-duration cash flows. Megacap technology earnings sit furthest out in time, so a higher discount rate compresses their multiples first, and debt-financed AI capital spending adds a credit channel because refinancing costs now key off a 5.05% base. Small caps gained for a different reason. The front end eased, with the 2Y -2.9% WoW, which lowers the floating-rate burden on Russell 2000 balance sheets, but IWM's trend signal is still down, so we read the bounce as relief inside an unchanged regime. The implication is that index stability at +11.2% YTD masks a multiple de-rating in the highest-duration growth segment, and HYG at -4.0% YTD says equity investors are underpricing financing risk. We hold SPY neutral for its earnings support, underweight QQQ for its rate sensitivity, and keep IWM neutral given the down trend. The trade-off is that we lag over the next quarter if megacap guidance surprises higher. We would move QQQ to neutral if it reclaims 759.66 with the 10Y below its 52-week high of 5.31%, a combination showing multiples absorbing current rates. A 10Y close above 5.31% would push SPY to underweight.
Commodities
Gold is the clearest casualty of the real-rate regime. GLD closed at 360.26, which is its 52-week low, -1.7% WoW and -9.5% YTD, and 27.4% below its 52-week high of 495.90. It fell in a week when the dollar index was flat at -0.1% and the 10Y eased -1.6%, so the weakness did not need a fresh rate shock to extend. The mechanism runs through opportunity cost and then positioning. A 10Y at 5.05% makes zero-yield bullion expensive to hold, and with the 2Y at 4.67% even short-dated paper earns a carry gold cannot match. The earlier rally was amplified by trend-following and leveraged flows; once momentum turned, those same flows sell into weakness, so price falls faster than the rate move alone implies. An energy supply shock would normally support gold as an inflation hedge, but the hawkish policy response to that shock lifts yields and overrides hedge demand. Energy data carries caveats this week: WTI at $103.37/bbl, -4.2% WoW, shows a 0.5% divergence between primary and cross-check sources, and Brent feeds failed reconciliation outright, so we do not size a crude call. We are underweight GLD over a one-to-three-month horizon. We accept that a geopolitical escalation could trigger a sharp short-covering rally against us. We would move to neutral if GLD holds 360.26 while the 10Y falls below 4.67%, a configuration that would show real-rate pressure receding and momentum sellers exhausted. A further leg lower with the 10Y above 5.31% would confirm the opportunity-cost channel is still dominant.
Digital Assets
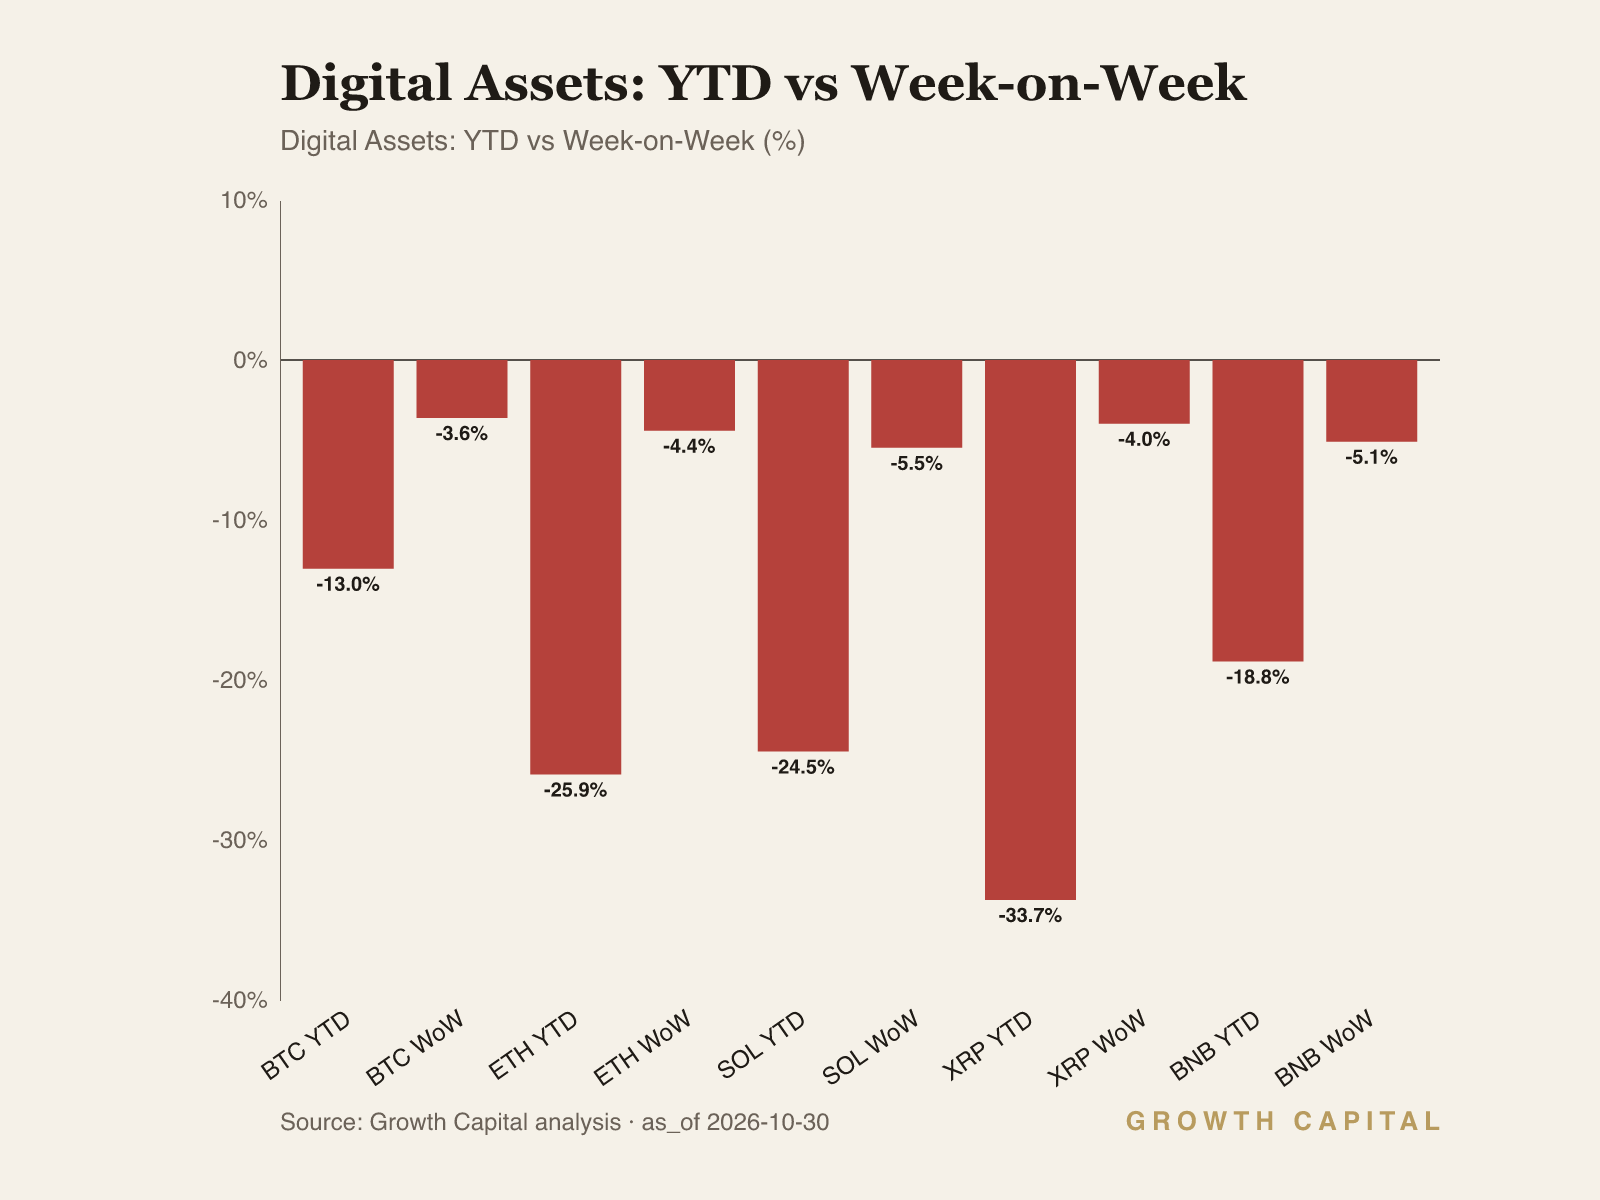
We are neutral BTC and underweight ETH. BTC fell -3.6% WoW to $77,216.8, -13.0% YTD and 10.8% below its 52-week high of $86,599.2, while ETH dropped -4.4% to $2,225.74 and is -25.9% YTD. Total crypto market capitalisation is $2.72T, -3.3% over 24 hours, and BTC dominance sits at 57.02%. The transmission is liquidity. With the 10Y at 5.05% and the 2Y 92bp above the policy rate, the hurdle for holding non-yielding, high-beta assets rises, and the marginal leveraged buyer funds positions at a cost set off a 3.75% policy floor. That pressure falls hardest on the assets furthest out the risk curve, which is why SOL fell -5.5% and BNB -5.1% while BTC lost less. Dominance at 57.02% expresses that pecking order: capital consolidates in the asset with the deepest institutional demand when funding tightens. Our implication over a one-to-three-month horizon is to hold BTC at neutral as the quality leg of the complex and underweight ETH as the higher-beta leg. We accept missing a sharp alt-led rebound if real rates drop quickly. We would move BTC to overweight if it reclaims $86,599.2 while the 10Y holds below 5.05%, which would show liquidity loosening rather than a short squeeze. We would close the ETH underweight if ETH outperforms BTC on a weekly basis while dominance falls below 57.02%, a sign that risk appetite is broadening across the complex. A 10Y close above 5.31% would push BTC to underweight alongside equity beta.
GC Views
| Asset | View | Rationale |
|---|---|---|
| US_10Y | UW | UW long duration: 10Y at 5.05% sits 26bp under its 5.31% high, term premium exposed to energy inflation. |
| US_2Y | OW | OW front end: 2Y at 4.67% earns 92bp over the 3.75% policy rate and already prices tightening. |
| HYG | UW | HYG at 77.47 is 0.9% above its 76.81 low and -4.0% YTD; refinancing keys off a 5.05% 10Y. |
| SPY | N | SPY +11.2% YTD, 2.5% below its 779.09 high; earnings support offsets credit's -4.0% YTD warning. |
| QQQ | UW | QQQ -1.4% WoW, 8.6% below its 759.66 high; longest-duration cash flows face a 5.05% 10Y. |
| IWM | N | IWM +2.5% WoW on front-end relief, but its trend signal is down; we do not chase the bounce. |
| GLD | UW | GLD at its 52-week low of 360.26, -9.5% YTD; zero-yield bullion loses to a 5.05% 10Y. |
| BTC | N | BTC -3.6% WoW to $77,216.8 with 57.02% dominance; quality leg of crypto, no add below $86,599.2. |
| ETH | UW | ETH -25.9% YTD; smart-money perps net short and spot ETF outflows outweigh exchange withdrawals. |
| EURUSD | UW | EUR/USD 1.1199, -4.6% YTD; a 167bp US-Bund 10Y gap and energy terms-of-trade drag favour USD. |
On-Chain Pulse
The on-chain tape this week shows a mixed cohort lean: exchange withdrawals dominate across BTC, ETH, XRP and BNB, while Solana is the only major with a net exchange inflow and verified fund selling. Smart-trader spot flows are small relative to exchange movements, and the intel block carries no whale-cohort sizing, exposure ratios or Hyperliquid funding prints this week, so we do not report those fields rather than estimate them. Exchange withdrawals reduce exchange-held supply but do not by themselves prove purchases.
Bitcoin. Smart Traders were net sellers of Bitcoin on the Ethereum WBTC wrapper, at -$284.3k over the seven days to 30 October, while the wrapper recorded a $91.7M exchange outflow. Abraxas Capital withdrew $17.9M of wrapped Bitcoin from Binance in three tranches and supplied $17.1M to Spark, a DeFi deposit and not a sale. ETF demand diverges from the smart-trader lean: US spot Bitcoin ETFs took in $137.5M on 28 October, equal to 1,691.3 BTC, and a further $17.06M net on the latest reported day. These wrapper figures describe WBTC markets and not the native network, and no whale ratio or funding level is available for BTC. For positioning, institutional ETF absorption against a -3.6% WoW price decline supports our neutral BTC view, and we would not add until smart-trader flow turns positive.
Ethereum. Ethereum recorded the largest exchange withdrawal among the majors, a $1.5B outflow over seven days, with Smart Traders net buyers at +$296k. Abraxas added 11.7k ETH to its wallet balance and received $26.9M of Ethereum from Bitfinex on 30 October, while a QCP wallet added 1.2k ETH. Derivatives tell the opposite story, as smart-money perps positioning remained net short over the period, the clearest spot-versus-perps divergence in the complex. ETF flows side with the derivatives lean, with US spot Ethereum ETFs posting a -$25.9M outflow on 28 October and a -$105.5M outflow on the latest reported day. Absent a funding print, we weight the ETF and derivatives signals above the spot withdrawals and keep ETH underweight; sustained ETF inflows would challenge that call.
Solana. Solana is the only major with a net exchange inflow, at $34M over seven days, which adds to exchange-held supply available for sale. Smart Traders were modest net buyers at +$142.6k, far too small to offset that inflow. Sigil Fund net sold $1.1M on DEXs, the clearest verified fund selling in the week's data. The intel block carries no whale ratio, open-interest or funding level for SOL. Price confirms the flow, with SOL -5.5% WoW to $95.81 and -24.5% YTD, so we treat it as a high-beta expression of tighter liquidity and hold no long tilt until exchange flows turn to net withdrawals.
XRP. XRP data is thin and we size our read accordingly. On the Base CBXRP wrapper, Smart Traders showed no significant flow and the exchange net flow was a $504.5k outflow, figures that describe the wrapped market and not the native ledger. Verified fund activity is not available for the period. The one institutional signal is a +$5.8M US spot ETF inflow on 28 October, which diverges from flat smart-trader activity. Price is -4.0% WoW to $1.24 and -33.7% YTD, the weakest YTD print among the majors, and with no funding or open-interest level available we keep XRP outside our crypto preference set.
BNB. BNB saw a $175.6M exchange outflow over seven days, the second-largest withdrawal after ETH, alongside Smart Trader net buying of +$296k. Identified fund DEX net buying was only $29.4, so no meaningful institutional signal sits behind the withdrawals. Price weakness was broad, with BNB -5.1% WoW to $700.59 and -18.8% YTD. The intel block carries no whale exposure ratio, funding rate or open-interest level for BNB this week. Withdrawals without fund confirmation are insufficient to justify exposure in a tightening liquidity regime, so we keep BNB outside our crypto preference set until verified fund buying appears.
What We're Watching
10Y versus 5.31%: a close above the 52-week high moves us from hawkish hold to term-premium break and cuts equity beta further. 2Y versus 3.75%: a break below the policy rate flips our duration call to overweight. HYG versus 76.81: a close below the 52-week low deepens our credit underweight and pushes SPY toward underweight, while a recovery to 81.18 with the 10Y below 5.05% moves SPY to overweight. EUR/USD versus 1.1123: a close below the 52-week low extends our dollar preference. GLD versus 360.26: holding this low with the 10Y below 4.67% moves gold to neutral. BTC versus $86,599.2: reclaiming the 52-week high with the 10Y below 5.05% moves BTC to overweight.
This Week in Charts