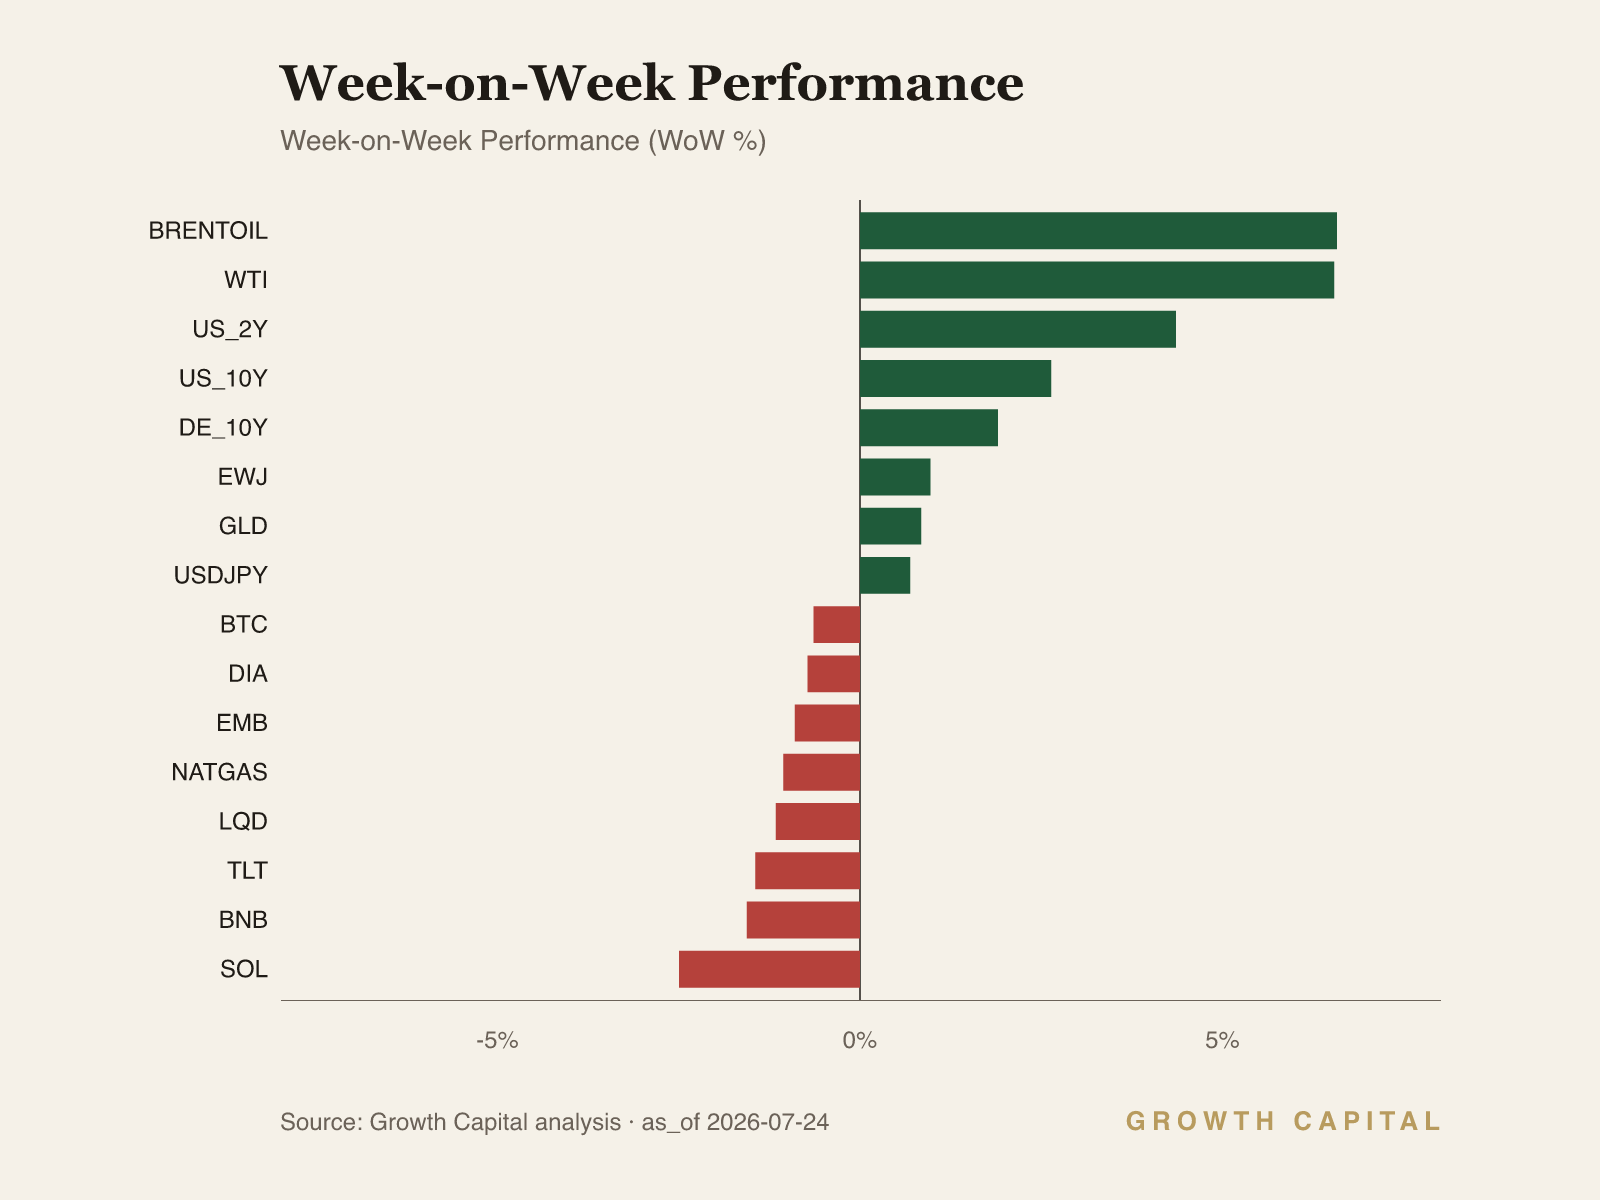
The Treasury curve repriced to twin 52-week highs and the market is pricing hikes, not cuts. The 2Y at 4.31% sits 68bp above the 3.63% effective funds rate, and the 10Y at 4.67% dragged TLT -1.4% WoW to 83.30, 0.28 above its 83.02 52-week low.
Credit confirms a duration shock, not a default shock. LQD fell -1.2% to 106.31 against a 106.26 52-week low while HYG gave up only -0.5% to 79.27, so the loss channel is the risk-free curve, not corporate balance sheets.
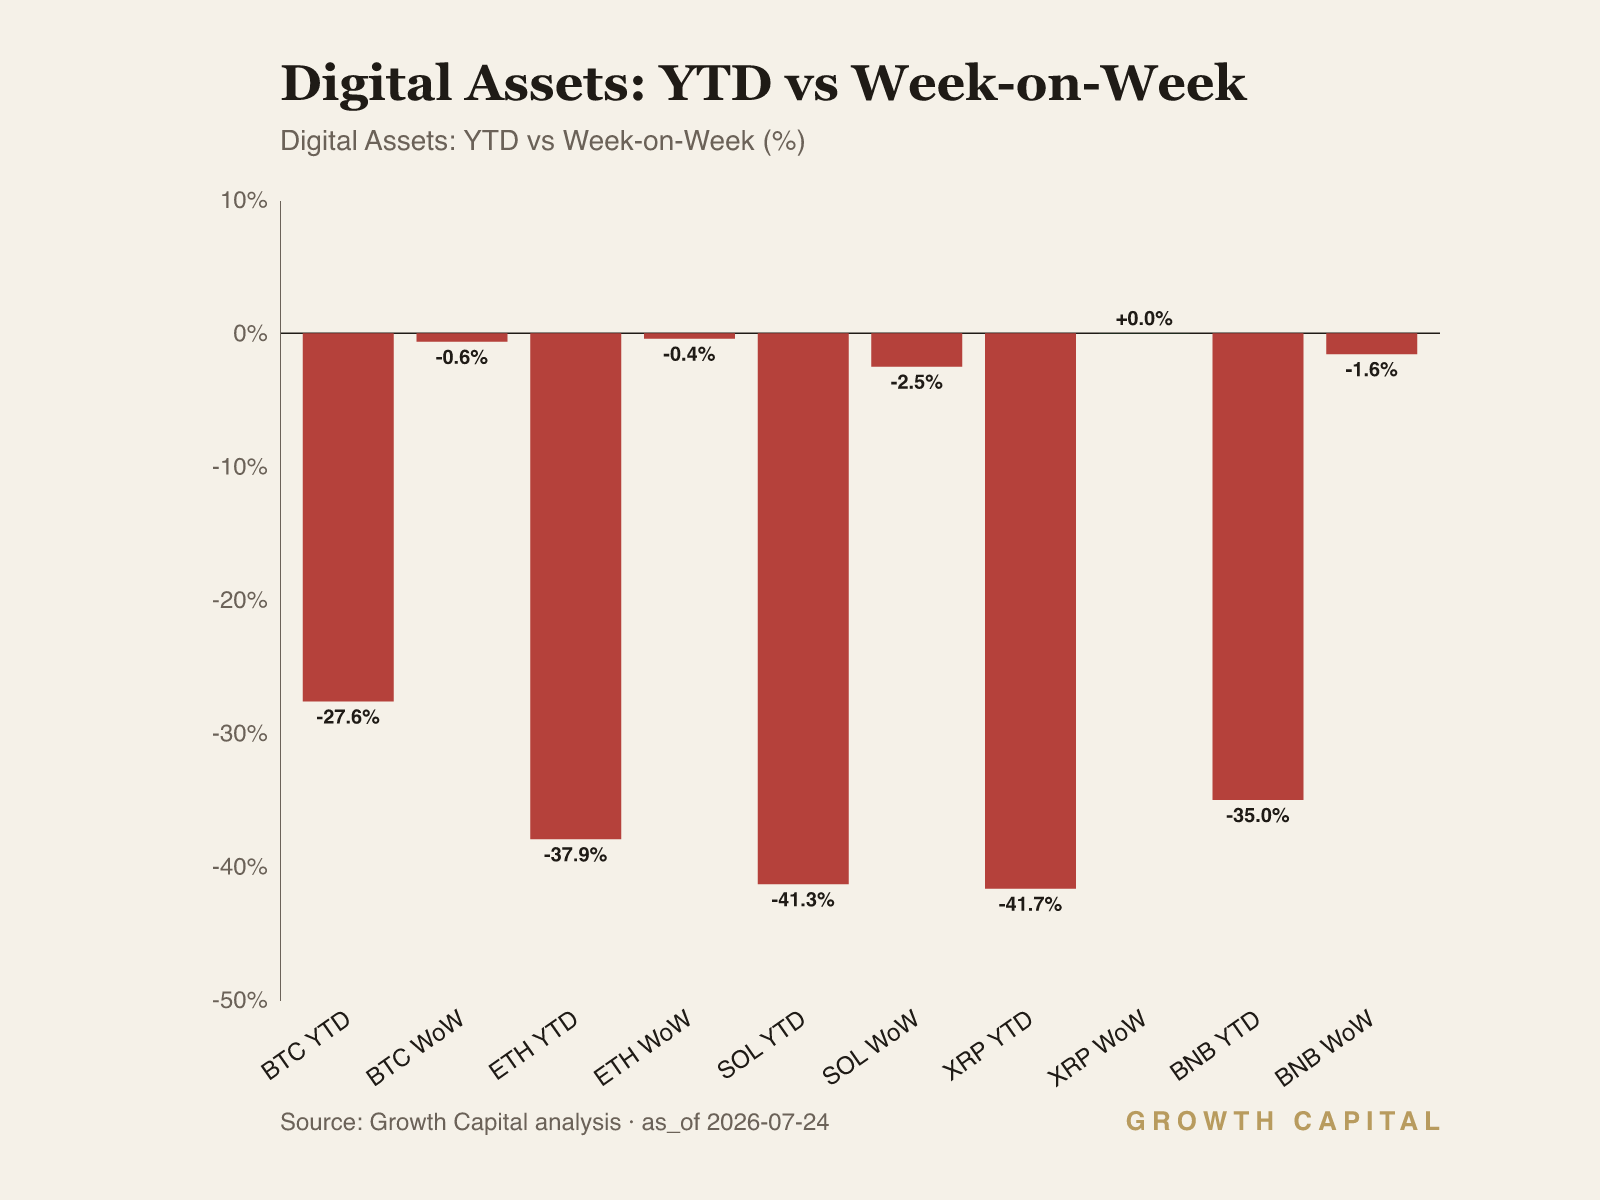
The energy tape is the transmission channel and digital assets remain offside. Our primary feed marks Brent +6.6% WoW at $86.99/bbl, a print we flag for cross-source divergence, while BTC at $64,278.9 is -27.6% YTD with smart traders net short $60.5M on Hyperliquid.
Our positioning: The bond market is repricing the last mile toward hikes, not cuts; stay short duration until the 2Y breaks below 4.00%.
Twin 52-week yield highs reset the policy path and put duration at the centre of portfolio risk
Our regime read this week is a hawkish repricing: the bond market has stopped pricing the last mile of disinflation and started pricing the risk that policy tightens again. Both legs of the Treasury curve closed at 52-week highs, the 2Y at 4.31% (+4.4% WoW) and the 10Y at 4.67% (+2.6% WoW), a 36bp gap between them. With the effective funds rate at 3.63%, the front end now carries a 68bp premium to policy; that is a market telling the Fed it believes the next move is up. The proximate cause is an energy-led inflation scare tied to Red Sea supply disruption; our primary feed marks Brent at $86.99/bbl, +6.6% WoW, and cross-check pricing runs materially higher, so we treat the level as directionally right and precisely uncertain. Equities absorbed the shock with modest damage, SPY -0.6% WoW at 739.05 and still +8.2% YTD, but the cross-asset pattern (TLT -1.4%, LQD -1.2%, GLD +0.8%) is the signature of an inflation shock rather than a growth shock. We are underweight duration, neutral US equity beta, and overweight the dollar. The rest of this note works through the mechanism and names the prints that would change our mind.
Start with the front end. The 2Y closed at 4.31%, a 52-week high, up +4.4% WoW and +24.2% YTD, and it dragged the complex with it: the 10Y printed 4.67%, also a 52-week high, the German 10Y rose to 3.21%, and TLT fell -1.4% to 83.30, 0.28 above its 83.02 52-week low. The transmission channel runs from energy prices to headline inflation expectations to the policy reaction function to the discount rate. An energy repricing of this size feeds import and producer prices within one to two quarters, and a central bank that spent two years restoring credibility cannot look through it, so the market strips cuts out of the strip and begins adding hike premium; that repricing lands first at the 2Y, which is why the front end is up +24.2% YTD against +11.5% for the 10Y and why the curve has flattened to a 36bp gap (4.67% versus 4.31%). The second link is rates to duration to multiples: every asset priced off a long discount rate, from TLT to QQQ, gets re-marked lower as the risk-free leg resets, and that is precisely the pattern of this week's tape. We are underweight duration across Treasuries and IG credit on a three-to-six-month horizon, expressed through underweights in TLT and LQD, and we accept the trade-off that we forgo carry and convexity should growth roll over faster than the inflation impulse fades. That is a cost we can price; being long duration into a hike repricing is not. The falsifier is a 2Y print back below 4.00%, which would tell us the hike premium is unwinding and the reaction-function scare has passed; we would re-add long-end duration on that signal. Until then, the burden of proof sits with the bond bulls.
The equity and credit tape confirms the P1 regime rather than contradicting it. SPY fell -0.6% WoW to 739.05 and QQQ -0.6% to 690.94, while in credit LQD dropped -1.2% to 106.31, 0.05 above its 106.26 52-week low, and HYG gave up only -0.5% to 79.27 against a 78.72 low. The composition is the tell. IG credit is a duration instrument dressed as a spread product, so a -1.2% week in LQD alongside a -1.4% week in TLT says the loss channel is the risk-free curve, not corporate balance sheets; were default risk repricing, HYG would be underperforming LQD, and it is doing the opposite. There is a funding-side link as well: the AI-capex build-out that anchors the index's largest names is capital-intensive and cash-flow-strained at a higher discount rate, tying that complex directly to the same rate reset that is hitting TLT. We hold US equity beta at neutral through SPY, take QQQ to underweight because the longest-duration cash flows carry the most repricing risk after a +12.7% YTD run, and keep HYG neutral while spreads behave. Neutral beta forgoes upside if the energy impulse fades quickly; we accept that against the asymmetry of a 4.67% risk-free rate. A weekly HYG close below 78.72 would mark the shock jumping from the duration channel into the credit channel, and we would cut beta to underweight; LQD stabilising above 106.31 with the 10Y holding 4.67% would say the worst of the duration mark is in.
The second most material rail this week is FX, where the dollar is doing exactly what the rates complex says it should. DXY held 120.53 (+0.02% WoW, +0.8% YTD) inside a 117.44 to 121.92 52-week range, EURUSD sat at 1.1440, slightly oversold and -2.5% YTD, and USDJPY pushed +0.7% to 162.43, just below its 162.67 52-week high. The mechanism is reaction-function divergence: the US front end is repricing toward hikes while the ECB held policy unchanged this week, so the short-rate differential widens and carry flows into the dollar leg. The yen is the stress point, because a 162 handle prices maximal carry and minimal intervention risk at the same time, and those two assumptions cannot both survive a break of the 52-week high. Risk coherence with the P1 regime checks out: a firm dollar, weak bonds, soft equities and a modestly bid gold (GLD +0.8% WoW despite dollar strength) all describe the same inflation-scare state. We stay overweight the dollar and underweight EURUSD, and we would reduce yen-funded positioning above 162.67 rather than press it.
What would change our view is specific and levelled. On the downside, a 10Y sustained above 4.67% combined with a weekly HYG close below 78.72 would signal the shock migrating from duration into credit, and we would cut equity beta to underweight and add to dollar length. On the upside, a 2Y print below 4.00% alongside an energy retracement would signal the hike premium unwinding, and we would rotate back into duration through TLT and re-rate QQQ toward neutral. A USDJPY break of 162.67 is the third trigger: it raises the probability of official intervention and a carry unwind, which is a volatility event for every risk asset regardless of the macro read. In digital assets, a BTC close below its 58,608.4 52-week low would confirm the liquidity regime is still tightening for the marginal risk taker. None of these are vibes; each is a print we can mark on a screen. Our conviction this week rests on the front end, and the front end is falsifiable at 4.00%.
Source: GrowthCapital analysis; market data from GC snapshot as of 24 Jul 2026; Nansen; Hyperliquid.
Fixed Income
The front end set the week's agenda. The 2Y closed at 4.31%, a 52-week high, +4.4% WoW and +24.2% YTD, while the 10Y printed 4.67%, also a 52-week high, leaving the curve at a 36bp gap (4.67% versus 4.31%). Against an effective funds rate of 3.63%, the 2Y now carries a 68bp premium to policy; that premium is the market's estimate of unfinished tightening, and it built sharply this week as the energy shock fed back into inflation expectations. The mechanism runs through the reaction function: a central bank that held in June cannot validate an energy-led inflation impulse with cuts, so the strip removes them and the front end resets higher, dragging every duration instrument with it. TLT fell -1.4% to 83.30, 0.28 above its 83.02 52-week low and -4.3% YTD; LQD fell -1.2% to 106.31, 0.05 above its own 106.26 low; HYG's -0.5% move to 79.27 was the mildest mark in the complex, which tells us the loss channel is duration, not credit quality. The German 10Y at 3.21% (+1.9% WoW) confirms this is a global repricing, not a US idiosyncrasy. We are underweight 10Y duration, TLT, and LQD on a three-to-six-month horizon, and neutral HYG while spreads behave. The falsifiers are explicit: a 2Y print below 4.00% re-opens the duration trade because it marks the hike premium unwinding, while a weekly HYG close below the 78.72 52-week low flips high yield to underweight because it would mark the shock's migration into the credit channel proper.
Equities
US equities absorbed a 52-week-high discount rate with modest, orderly damage, and the composition matters more than the level. SPY fell -0.6% WoW to 739.05, still +8.2% YTD; QQQ fell -0.6% to 690.94, +12.7% YTD; IWM gave up -0.5% yet leads the year at +17.6%. The one green print was EWJ, +1.0% WoW and +12.3% YTD, and the driver is visible in the FX tape: USDJPY at 162.43 subsidises the exporter complex even as the local market wrestles with AI capex anxiety. For the US complex the mechanism is rates to duration to multiples: a 10Y at 4.67% re-marks the present value of long-dated cash flows, and the longest-duration cash flows in the index belong to the AI platforms, whose capital-intensive build-out is most exposed as the discount rate resets. That linkage is why we differentiate within beta rather than sell it wholesale; the drawdown is orderly, neither SPY nor QQQ is overbought on our indicators, and credit spreads are quiet. We hold SPY at neutral, take QQQ to underweight on discount-rate sensitivity after its +12.7% YTD run, keep IWM neutral given small-cap funding exposure to a rising front end, and hold EWJ overweight as the cleanest currency-subsidised earnings story on the board. A 2Y back below 4.00% restores the QQQ case; a weekly HYG close below 78.72 cuts the whole complex to underweight.
Forex
The dollar complex is the cleanest expression of the week's regime. DXY held 120.53, +0.02% WoW and +0.8% YTD, in the upper half of its 117.44 to 121.92 52-week range; EURUSD closed at 1.1440, slightly oversold on our indicators and -2.5% YTD; USDJPY rose +0.7% to 162.43, just below its 162.67 52-week high. The channel is reaction-function divergence: the US front end repriced toward hikes this week, with the 2Y at a 4.31% 52-week high, while the ECB left policy unchanged and stayed data-dependent, so the short-rate differential widens in the dollar's favour and carry does the rest. The yen is where the carry is fattest and the risk most binary, because at 162.43 the pair prices maximal rate differential and minimal intervention probability at the same time, and a break of 162.67 tests the second assumption directly. A carry unwind from these levels is a volatility event for every risk asset, not a currency story in isolation. Coherence with the regime read checks out: a firm dollar, weak bonds, soft equities and a modestly bid gold (GLD +0.8% WoW despite dollar strength) all describe the same inflation-scare state. We are overweight the dollar, underweight EURUSD against that policy divergence, and neutral USDJPY, unwilling to fund fresh yen shorts this close to the high. A 2Y print below 4.00% compresses the differential doing all the work and is the falsifier for dollar length.
Digital Assets
Digital assets remain the offside asset class of 2026, and this week's tape did nothing to change that. BTC closed at $64,278.9, -0.6% WoW and -27.6% YTD, against a 52-week range of $58,608.4 to $96,897.7; ETH at $1,864.02 is -37.9% YTD; SOL at $74.44 fell -2.5% WoW and is -41.3% YTD. BTC dominance at 56.25% with total market cap near $2.3T tells us the drawdown is broad, with capital consolidating into the largest asset within the class. The mechanism is the same discount-rate channel hitting QQQ, amplified: crypto is the longest-duration, most liquidity-sensitive exposure on the board, so a front end repricing toward hikes drains the marginal risk budget that funds it. The on-chain cohort data sharpens the read: professional cohorts on Hyperliquid are net short across the majors, with smart traders short $60.5M in BTC and whales short $38.6M on a $2B gross book, even as ETH spot exchange outflows ran to $370.5M this week, a hedged posture consistent with institutions accumulating coins while renting downside protection. We are underweight BTC and SOL, and neutral ETH, where top-PnL wallets added +$39.1M of inflows, the most constructive cohort mix of the group. The change-of-view triggers are explicit: a BTC weekly close below the $58,608.4 52-week low confirms capitulation and keeps us underweight, while a 2Y below 4.00% combined with HL cohorts covering to net long would move us back toward neutral on BTC.
GC Views
| Asset | View | Rationale |
|---|---|---|
| US_10Y | UW | 4.67% is a 52-week high with hike premium building; no duration until the 2Y prints below 4.00%. |
| US_2Y | UW | At 4.31%, 68bp over the 3.63% funds rate; the front end is still repricing the reaction function. |
| TLT | UW | -1.4% WoW to 83.30, 0.28 above the 83.02 52-week low; energy pass-through keeps duration offered. |
| LQD | UW | 106.31 against a 106.26 52-week low; IG is a duration loss channel, -3.5% YTD. |
| SPY | N | -0.6% WoW at 739.05, +8.2% YTD; a 4.67% 10Y caps multiples but earnings breadth holds the tape. |
| QQQ | UW | Longest-duration cash flows into a 4.67% 10Y; the +12.7% YTD run leaves the most repricing room. |
| DXY | OW | 120.53 with the 2Y at 4.31% behind it; policy divergence points toward the 121.92 high. |
| EURUSD | UW | 1.1440, -2.5% YTD; an ECB hold against a Fed strip pricing hikes keeps the pair heavy. |
| USDJPY | N | 162.43, a touch off the 162.67 high; carry is fat but intervention risk caps fresh shorts. |
| GLD | N | +0.8% WoW to 371.52 despite a firm dollar; real-rate drag caps upside, -6.7% YTD. |
| BTC | UW | -27.6% YTD at $64,278.9 with all HL pro cohorts net short ($60.5M smart traders). |
| ETH | N | $370.5M exchange outflows and +$39.1M top-PnL inflows against $11.1M HL shorts; best cohort mix. |
On-Chain Pulse
The aggregate on-chain pattern this week is a hedged institutional book. Spot cohorts are accumulating, exchange balances are draining in ETH and SOL, and top-PnL wallets are adding, yet every professional cohort on Hyperliquid perps is net short across the majors. We read the combination as coins being bought and downside being rented, a posture that resolves sharply once one side capitulates.
Bitcoin's cohort split is the most defensive of the group. On Hyperliquid, smart traders are net short $60.5M and whales net short $38.6M on a roughly $2B gross book, a net-to-gross ratio near 2% and roughly 0.6x the smart-trader short in absolute size; public figures carry a further $41.6M short, so all three professional cohorts lean the same way. The spot tape offers only partial comfort: top-PnL wallets added +$15.6M and whales a marginal +$81.9k at 2.5x their average clip. The divergence sits at the exchange door: BTC saw a net inflow of $5.9M to exchanges at 2.5x average, the only distributive exchange print among the majors and the opposite of ETH's outflow pattern, while public figures distributed -$4.5M on spot. With price at $64,278.9, -27.6% YTD, and dominance at 56.25%, the marginal flow is defensive rather than accumulative. We stay underweight BTC; a cohort flip to net long alongside resumed exchange outflows is the print that changes it.
Ethereum carries the most constructive cohort mix on the board. Top-PnL wallets added +$39.1M at 1.2x their average, the strongest smart-money accumulation of the group, and public figures added a further +$6.5M on spot. The spot-versus-perps divergence is stark: $370.5M net left exchanges this week and fresh wallets absorbed +$281.4M, yet on Hyperliquid smart traders are net short $11.1M and whales net short $18.4M on a $1.8B gross book, with public figures short another $10.2M. That whale short is roughly 1.7x the smart-trader short in size but only about 1% of gross exposure, which reads as a hedge rather than a directional bet. Smart traders' own spot flow was a negligible -$908.7k, so the accumulation is concentrated in the top-PnL cohort. At $1,864.02 and -37.9% YTD, coins are leaving exchanges into price weakness, the profile that precedes durable bottoms more often than breakdowns. We hold ETH at neutral and would move to overweight if the HL cohorts cover into continued exchange outflows.
Solana's picture is mixed and thinner. Smart traders accumulated +$438.6k on spot at 1.1x average and top-PnL wallets added +$1.5M, but whales distributed a net -$3.6M at 1.2x their average clip, the only outright whale spot distribution among the majors and roughly 8x the smart-trader accumulation in absolute size. Exchange outflows ran $72.4M, directionally supportive but at only 0.5x the average pace, so the spot bid is muted relative to ETH even as fresh wallets absorbed a striking +$864.2M. The Hyperliquid derivatives detail for SOL did not surface a complete book in this week's pull, so we withhold a funding and open-interest read rather than infer one. With price -2.5% WoW at $74.44 and -41.3% YTD, whale distribution into muted outflows is the deciding signal. We stay underweight SOL until whale flow turns positive and the perp cohort data confirms the turn.
What We're Watching
Four prints govern our positioning. First, the 2Y at 4.31%: a close below 4.00% signals the hike premium unwinding, and we re-add duration through TLT and lift QQQ toward neutral. Second, HYG at 79.27: a weekly close below the 78.72 52-week low marks the shock migrating from duration into credit, and we cut equity beta to underweight. Third, USDJPY at 162.43: a break of the 162.67 52-week high raises intervention odds and carry-unwind risk, and we would reduce dollar length rather than press it. Fourth, BTC at $64,278.9: a close below the $58,608.4 52-week low confirms the liquidity regime is still tightening, and we hold the underweight. A 10Y sustained above 4.67% compounds all four.
This Week in Charts