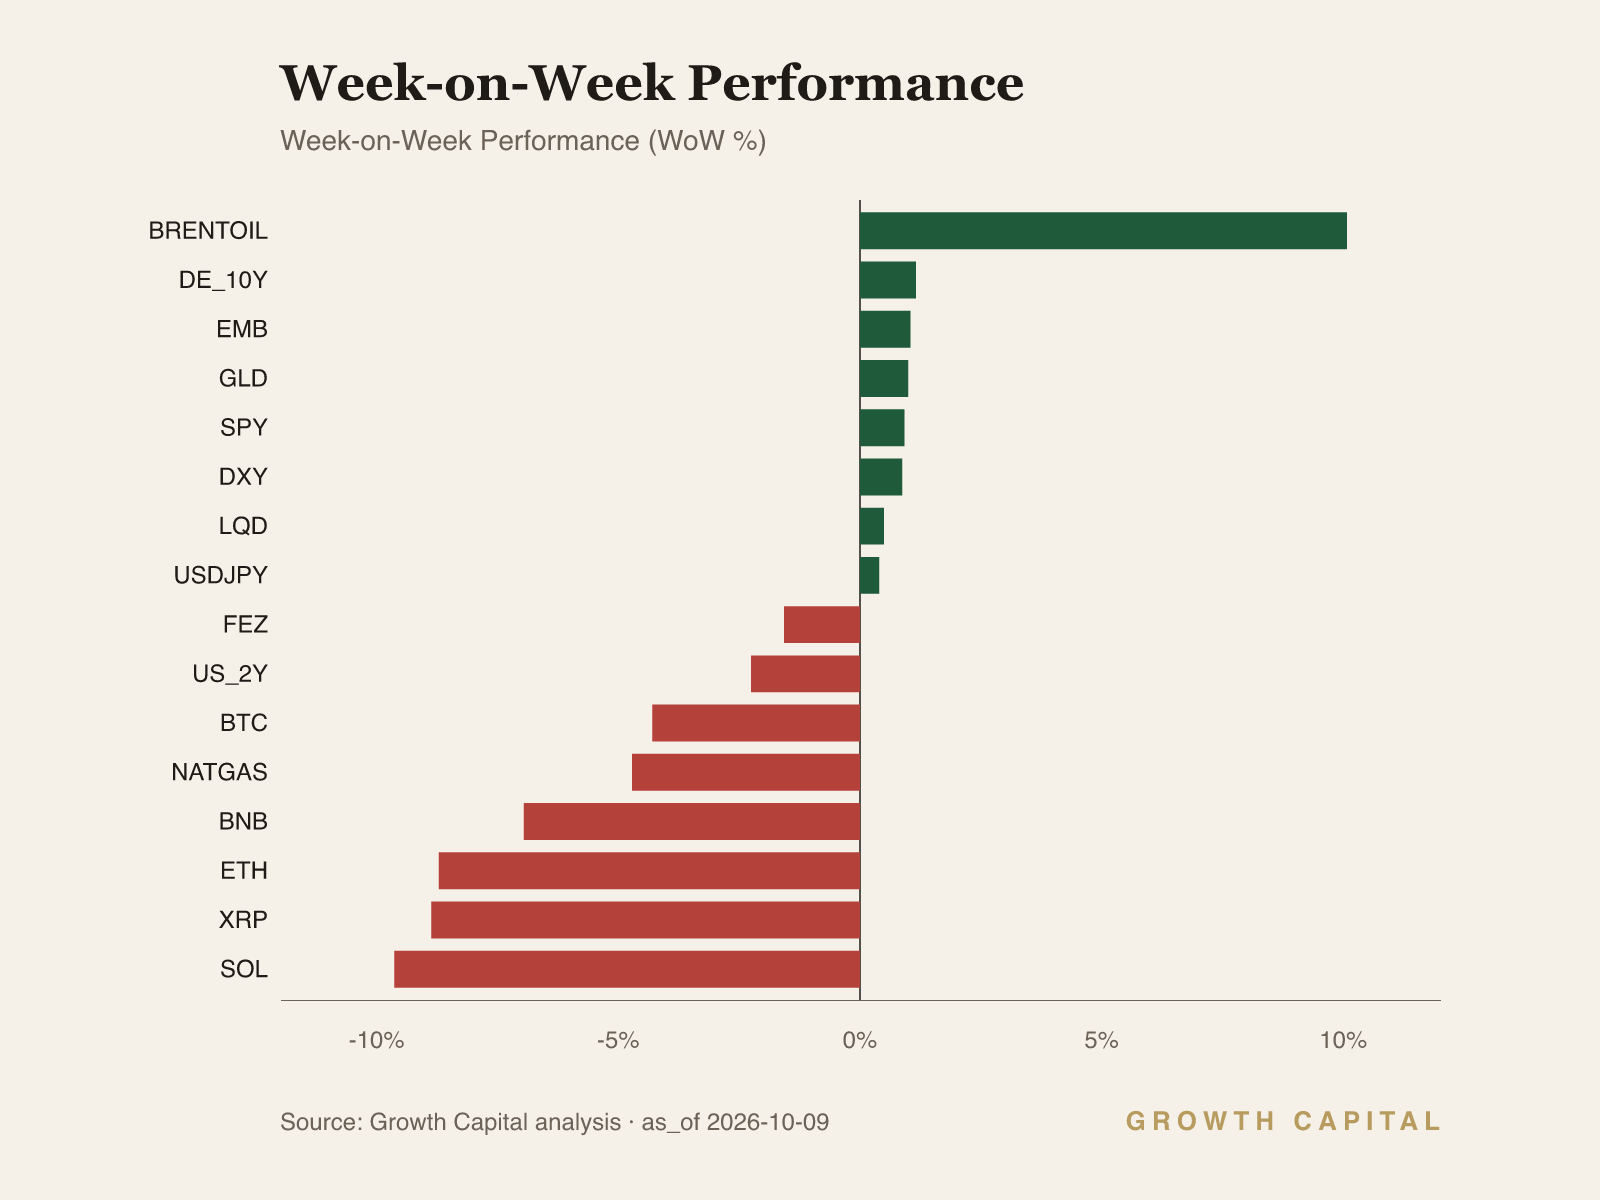
Duration risk now sits at the long end of the curve. The 10Y at 5.28% is 3bp below its 5.31% 52-week high, while the 2Y eased -2.3% WoW to 4.77%.
Index strength hides a credit and breadth warning. SPY sits 0.3% below its $779.09 high, yet HYG at $77.14 trades within touching distance of its $76.90 52-week low and IWM fell -1.2% WoW.
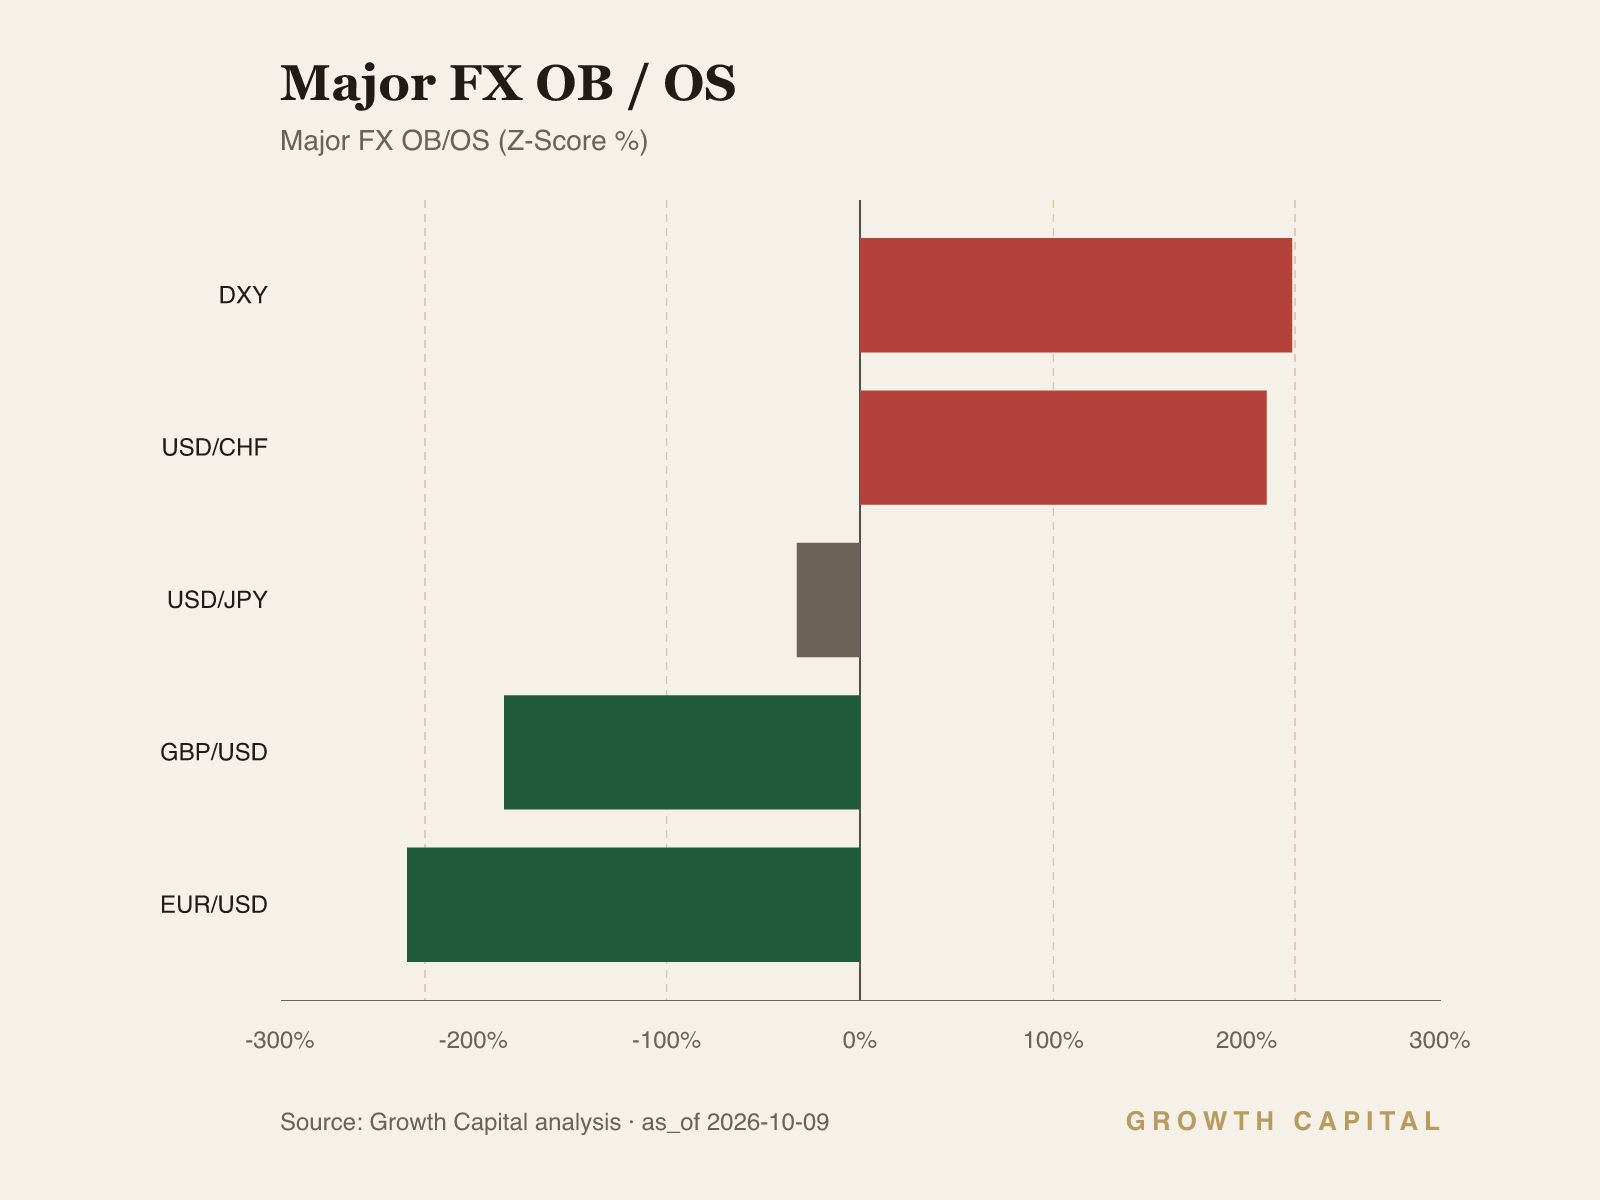
The dollar is the cleanest expression of the regime. DXY rose +0.9% WoW to 121.38, and EUR/USD at 1.1259 is 27 pips above its 1.1232 52-week low.
Our positioning: The front end already prices the Fed while the long end is still repricing risk, so we own 2Y carry and stay underweight long duration.
Long-end yields near 5.3% are pricing a risk the front end has already absorbed
Our regime read for the week is a stagflation lean with a term-premium warning. The 10Y Treasury closed at 5.28%, 3bp below its 5.31% 52-week high and +26.0% YTD in level terms. The funds rate sits at 3.75% in our latest reading. The 153bp gap between that 5.28% 10Y and the 3.75% policy rate is the number we anchor on, because it measures the compensation investors now demand for duration beyond the Fed's reaction function. Energy is the conditioning variable, but our primary feed's +10.1% WoW Brent print diverges from our crosscheck source by more than 19% on the level, so we use the direction of the shock and not the print. Growth has not cracked: unemployment is 4.2% and the last advance GDP print was 2.2%, so the bond market is repricing inflation persistence rather than recession. Our house view is that the long end, not the policy rate, is now the binding constraint on risk assets.
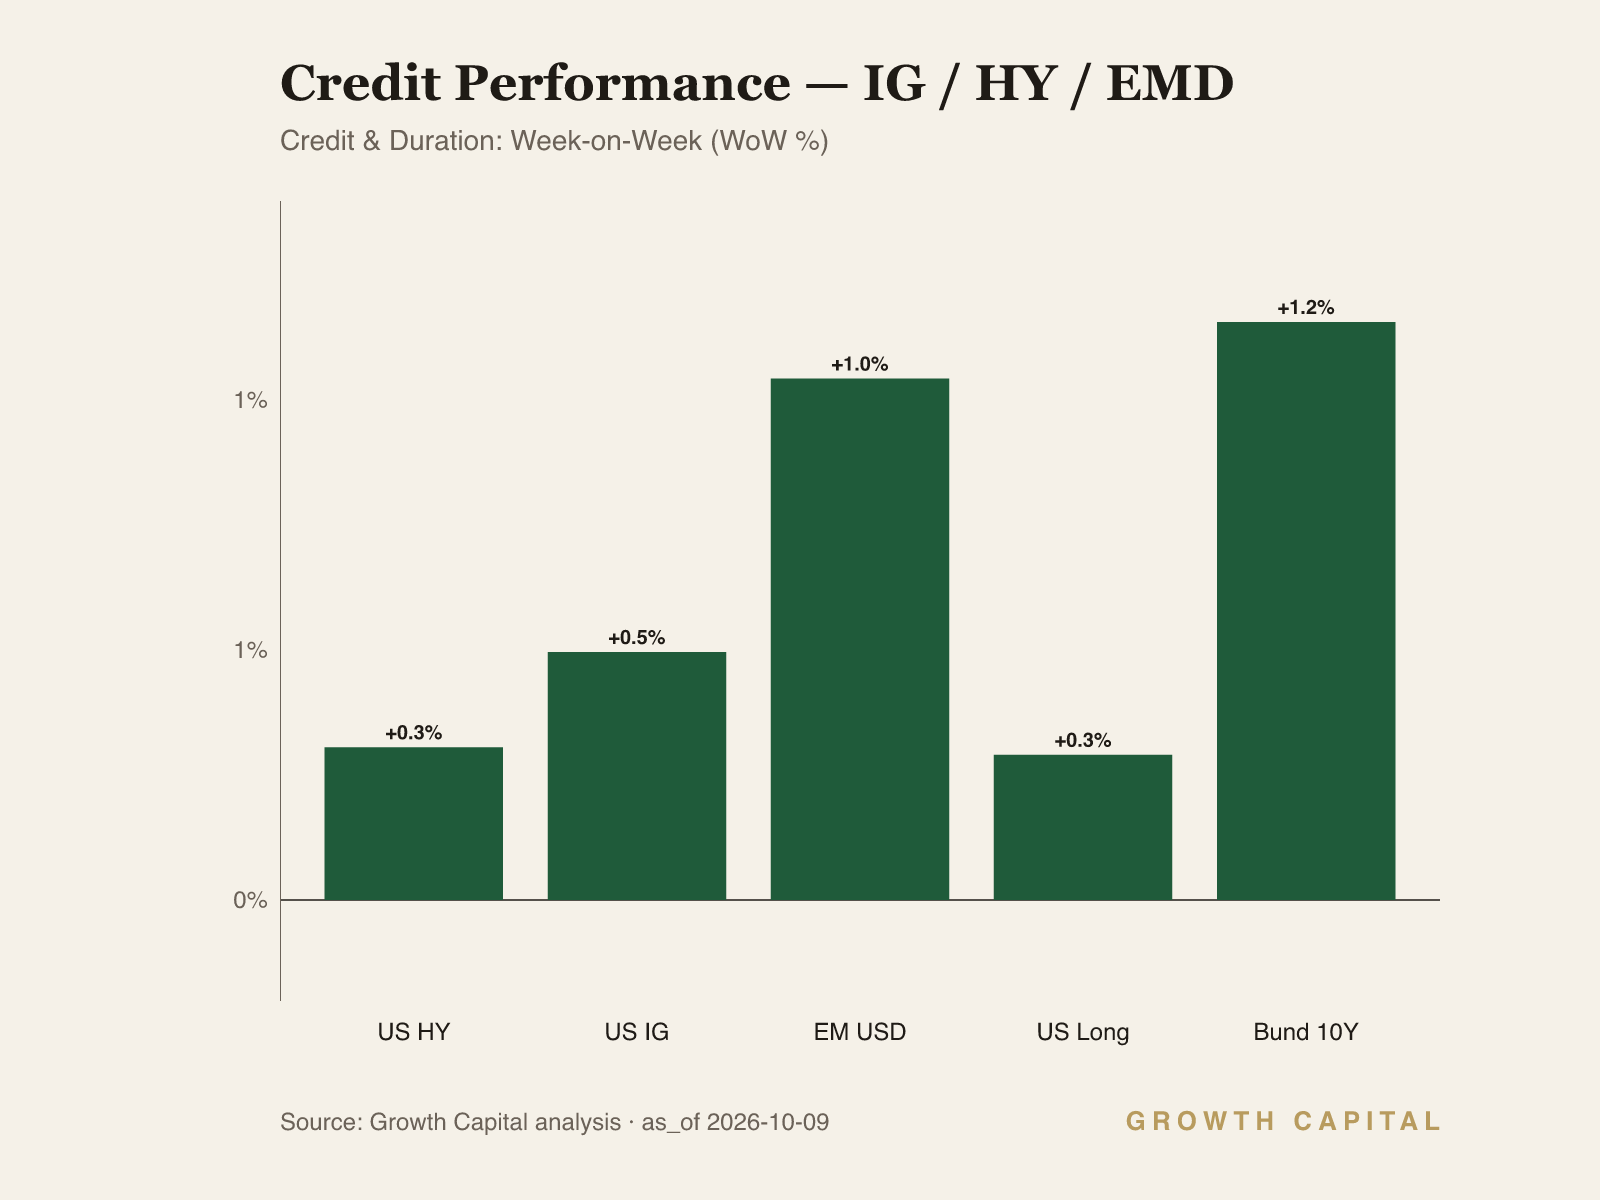
The front end and the long end decoupled this week. The 2Y fell -2.3% WoW to 4.77%, back from its 4.92% 52-week high, while the 10Y moved only -0.2% WoW; the 10Y at 5.28% versus the 2Y at 4.77% is a 51bp gap that held its width even as the Bund rose +1.2% WoW to 3.5%. The transmission runs through the policy reaction function first and term premium second. With the 2Y at 4.77% against a 3.75% funds rate, the front end already carries a 102bp premium over policy, and an energy shock that slows activity limits how much further the Fed can climb, which is why the 2Y rallied on softer oil headlines late in the week. The long end answers to a different channel: an energy-driven inflation impulse widens the range of future real rates, Treasury supply must clear at higher yields, and a Bund at 3.5% (+20.3% YTD in level terms) removes the cheaper overseas buyer, so the premium per year of duration rises even when policy expectations ease. We are overweight the 2Y, neutral the 10Y and underweight long duration via TLT on a 3-6 month horizon, a steepener posture that earns 4.77% of front-end carry and avoids TLT's convexity at $77.71, which is -10.7% YTD and only $0.60 above its $77.11 52-week low. The trade-off is explicit: if the energy shock fades quickly, we forgo the long-end rally a full duration overweight would capture. We would invert the call if the 2Y retakes its 4.92% high while the 10Y holds 5.28%, compressing the gap to 36bp, because that would show the Fed reasserting control of the curve through further hikes rather than the long end absorbing a term-premium shock.
The equity tape contradicts our regime read at the index level and confirms it beneath the surface. SPY rose +0.9% WoW to $776.72, 0.3% below its $779.09 high, yet IWM fell -1.2% WoW and sits 8.9% below its $305.09 high, while HYG at $77.14 is within touching distance of its $76.90 52-week low and -4.4% YTD. The channel is rates to refinancing cost to the marginal borrower. A 10Y at 5.28% resets the base rate on which small caps and high-yield issuers roll short-dated and floating debt, so margin pressure reaches the Russell 2000 and high-yield spreads within quarters, long before it touches net-cash mega-caps that earn more interest as yields rise. That is why QQQ at +22.6% YTD and DIA at +6.0% YTD diverge by 16.6 points: the index is a concentration bet on the cohort insulated from the funding channel. We resolve the tension with one number, the 18.1-point gap between SPY's +13.7% YTD and HYG's -4.4% YTD, which tells us the index has priced an insulation that credit does not grant. We hold SPY and QQQ at neutral and underweight IWM and HYG over three months; the cost is that we lag if mega-cap leadership extends into new highs. We side with credit because a market 0.3% from its high on narrowing leadership offers less margin of safety than a high-yield market already pricing stress. We would reverse if SPY breaks above $779.09 with IWM outperforming on the week, since that would show earnings growth outrunning the cost of capital and the refinancing channel failing to transmit.
The dollar rail confirms the P1 regime more cleanly than equities do. DXY rose +0.9% WoW to 121.38, 0.53 points below its 121.92 high, and EUR/USD fell -1.2% WoW to 1.1259, 27 pips above its 1.1232 low. The mechanism is terms of trade: the euro area imports its energy, so a higher oil bill drains euro real income and lifts corporate dollar demand. The rate gap reinforces it, with the US 10Y at 5.28% versus the Bund at 3.5%, a 178bp advantage for dollar duration, while French and peripheral bond stress adds a credit premium to euro assets. We are overweight DXY and underweight EUR/USD over 1-3 months, which is coherent with a risk-off undertone that equities have not yet priced. We would close the euro underweight if DXY fails at 121.92 while EUR/USD holds above 1.1232 and the UST-Bund gap narrows, because that would show the rate channel turning against the dollar.
What would change our view is a named threshold on the long end: a 10Y close above its 5.31% 52-week high would move the 10Y to underweight and extend the underweight to SPY, because term premium would then be overwhelming even the insulated mega-cap cohort. The downside scenario is a funding event, defined as HYG breaking its $76.90 low and TLT breaking its $77.11 low in the same week, which would confirm forced deleveraging and argue for adding to the 2Y overweight. The upside scenario is a fast energy unwind that drives SPY through $779.09 with IWM participation and lifts EUR/USD away from 1.1232, a disinflationary boom that would justify moving SPY to overweight. Gold stays neutral, with GLD at $383.93 and 22.6% below its $495.90 high, and we would cut it if it breaks its $362.32 low. These views are a draft for CIO review, not a personal recommendation.
Source: GrowthCapital analysis; market data from the weekly snapshot (FRED, ETF exchange prices, crypto aggregates).
Fixed Income
The curve is doing two jobs this week, and we price them separately. The 2Y fell -2.3% WoW to 4.77%, while the 10Y held at 5.28%, 3bp below its 5.31% 52-week high, and the Bund rose +1.2% WoW to 3.5%. TLT gained +0.3% WoW to $77.71 but remains -10.7% YTD, and LQD is -7.1% YTD, so the duration loss in investment grade exceeds the spread-driven loss in HYG at -4.4% YTD. That ordering tells us this year's damage has come from rates rather than default risk, the signature of a term-premium repricing. The mechanism has three links. An energy impulse widens the range of plausible inflation outcomes. Wider uncertainty raises the premium investors demand per unit of duration. A Bund at 3.5% then removes the lower-yielding overseas alternative that once absorbed Treasury supply, so the long end must clear at higher yields. The front end escapes most of this because its pricing is tethered to the Fed: the 2Y at 4.77% against a 3.75% funds rate already embeds a 102bp premium over policy. Our view is OW 2Y, N 10Y, UW TLT and UW HYG on a 3-6 month horizon, and we accept giving up convexity if inflation fades faster than we expect. HYG at $77.14, $0.24 above its $76.90 low, is the credit line we watch most closely, since a break would turn a rates story into a funding story. We would invert the steepener if the 2Y retakes 4.92% with the 10Y unchanged at 5.28%, because that would hand control of the curve back to the policy rate.
Equities
The S&P 500 proxy is near a record while the market beneath it is not. SPY rose +0.9% WoW to $776.72, 0.3% below its $779.09 52-week high, and QQQ added +0.3% to $751.98 for a +22.6% YTD gain. IWM fell -1.2% WoW to $278.07, FEZ lost -1.6% and EWJ -1.5%, so the US large-cap index was the outlier rather than the rule. DIA at +6.0% YTD against QQQ at +22.6% shows how narrow leadership has become. The mechanism is the cost of capital. With the 10Y at 5.28%, any borrower refinancing in the next year does so at the highest base rate of the past 52 weeks, and small caps carry more floating and short-dated debt than mega-caps. Net-cash technology companies earn more interest income as yields rise, so they are shielded from the channel that compresses small-cap margins. The risk premium the index embeds is therefore a premium for one cohort, and it shrinks as the risk-free rate climbs. We hold SPY and QQQ at neutral and IWM at underweight over three months; we give up upside if mega-cap earnings carry the index through $779.09. Ex-US weakness, with FEZ only +0.9% YTD, supports keeping incremental equity risk in the US rather than buying European dips. We would upgrade IWM to neutral if it outperforms SPY in a week when the 10Y prints at or above 5.28%, because that would show earnings breadth beating the refinancing channel rather than leaning on falling yields.
Forex
The dollar is the asset class that most cleanly expresses this week's regime. DXY rose +0.9% WoW to 121.38 and is +1.5% YTD, within 0.53 points of its 121.92 52-week high, while EUR/USD fell -1.2% WoW to 1.1259 and is -4.1% YTD. GBP/USD slipped -0.1% to 1.3234 and USD/CHF rose +0.1% to 0.8293, so sterling and the franc absorbed the shock with far less damage than the euro. The transmission runs through two channels at once. The first is terms of trade: an energy importer pays a larger bill in dollars, which raises corporate dollar demand and lowers euro-area real income. The second is the rate gap, with the US 10Y at 5.28% against the Bund at 3.5%, a 178bp advantage that rewards holding dollar duration. European fiscal stress compounds both, since higher French and peripheral yields reflect credit risk rather than growth and so weaken the currency rather than support it. Our view is OW DXY and UW EUR/USD on a 1-3 month horizon. USD/JPY at 157.81 stays neutral: the rate gap supports the pair, but its 163.86 52-week high sits where Japanese policy pushback becomes a live risk. The trade-off is carry against crowding, because EUR/USD is already flagged oversold and the next leg lower may come slowly. We would close the euro underweight if DXY fails at 121.92 while EUR/USD holds above its 1.1232 low and the UST-Bund gap narrows, since that would show the rate channel turning against the dollar.
Digital Assets
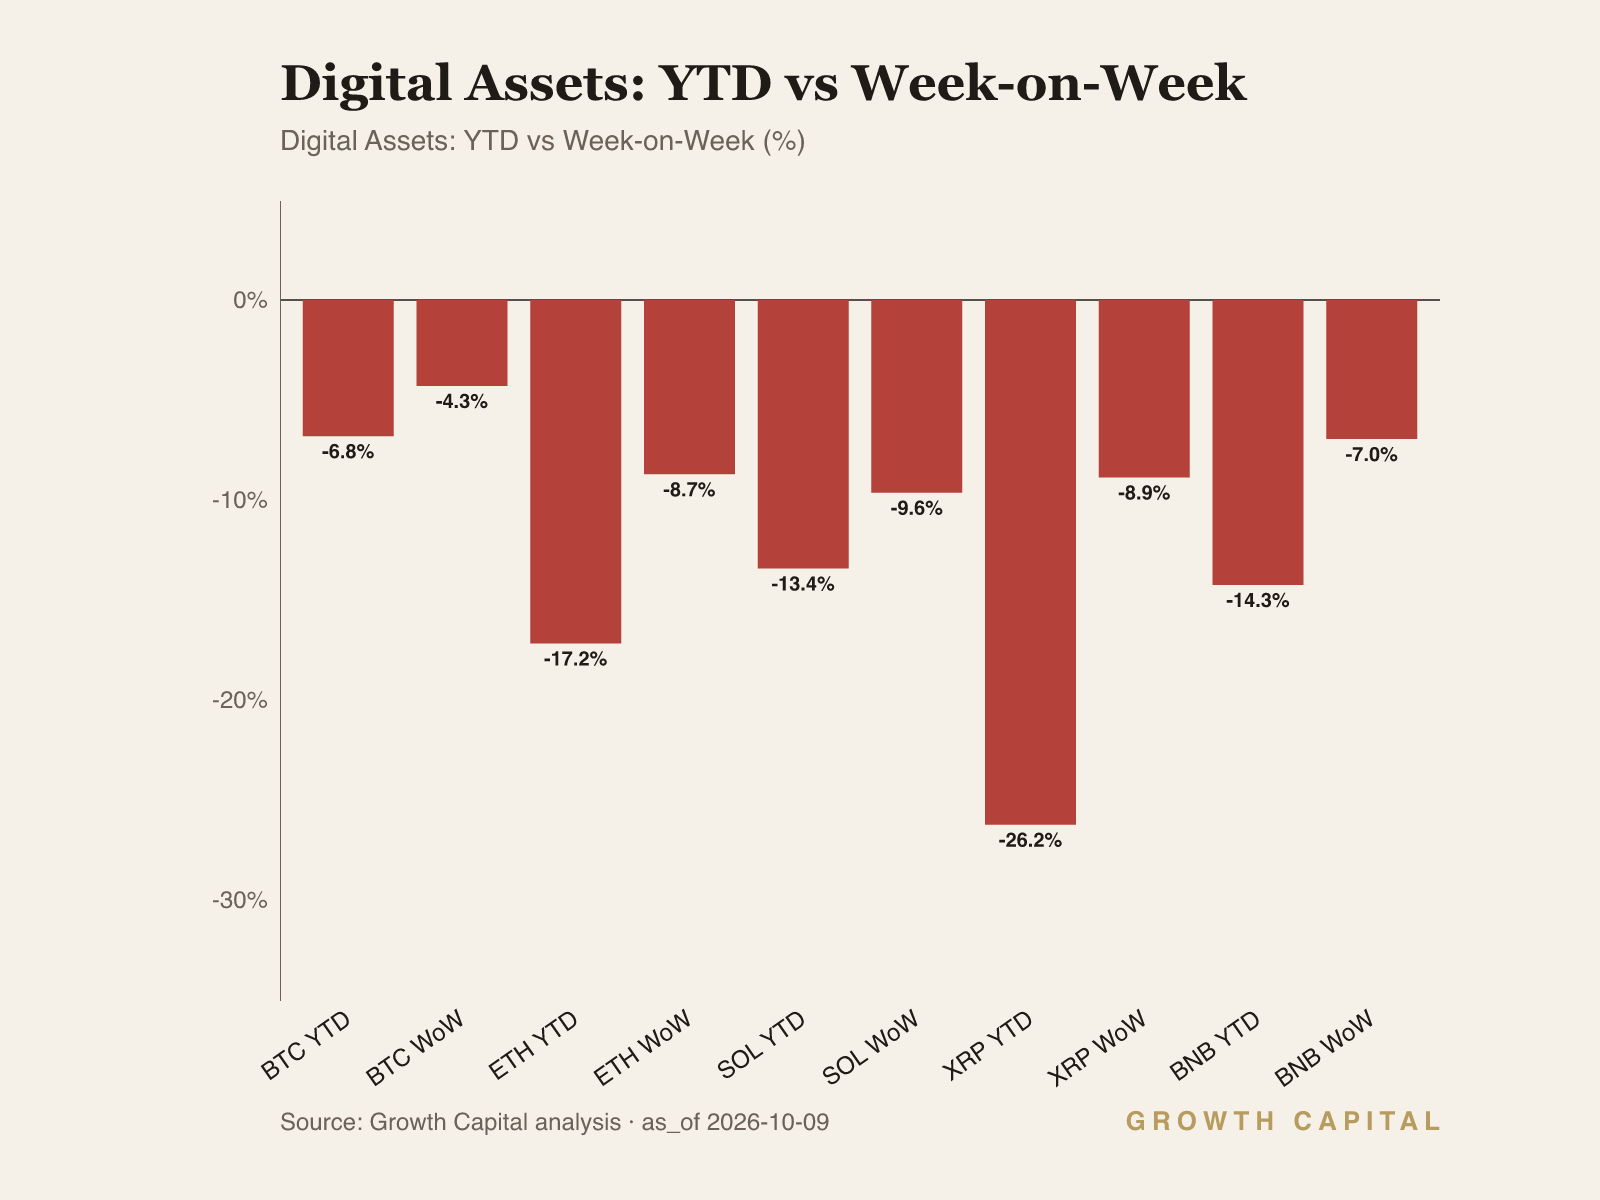
Crypto traded as the highest-beta expression of tighter funding this week. BTC fell -4.3% WoW to $82,758, but ETH lost -8.7% to $2,488.14, SOL -9.6% to $109.82, XRP -8.9% and BNB -7.0%, so losses scaled with each asset's beta to bitcoin. BTC dominance at 57% and total crypto market capitalisation of $2.92T show capital consolidating into the largest asset rather than leaving the class. The mechanism is leverage under a rising cost of money. With the 2Y at 4.77% and the dollar index at 121.38, the opportunity cost of holding non-yielding tokens rises, and the funding cost embedded in perpetual futures rises with it. Leveraged longs in smaller tokens hit margin limits first, forced selling pushes their prices furthest, and the dispersion we observed follows the order of liquidation. On-chain data offers one counterpoint: Nansen shows smart-money wallets as net ETH buyers over seven days even as the price fell. Our view is N on BTC and UW on ETH over one to three months, and we accept missing a sharp short-covering rally in the altcoin complex. BTC sits 4.4% below its $86,599 52-week high and keeps relative quality inside the class, which is why we do not extend the underweight to it. We would move ETH to neutral if it reclaims its $2,775.05 52-week high while BTC dominance falls below 57%, because that would show risk appetite broadening across the class rather than leverage unwinding from the edges inward.
GC Views
| Asset | View | Rationale |
|---|---|---|
| US_10Y | N | 5.28% sits 3bp under its 5.31% high; carry is fair, but long-end term premium stops us adding. |
| US_2Y | OW | 4.77% is 102bp over the 3.75% funds rate; the front end already prices the Fed and earns carry. |
| DE_10Y | UW | Bund at 3.5%, +1.2% WoW, faces fiscal and energy pressure; we stay underweight euro duration. |
| TLT | UW | -10.7% YTD and $0.60 above its $77.11 low; long-end convexity is the risk we avoid. |
| HYG | UW | $77.14 vs a $76.90 52w low, -4.4% YTD; marginal borrowers refinance off a 5.28% 10Y. |
| EURUSD | UW | 1.1259 is 27 pips above its 1.1232 low; terms of trade and a 178bp UST-Bund gap favour USD. |
| DXY | OW | +0.9% WoW to 121.38 near its 121.92 high; rate and terms-of-trade channels both back USD. |
| SPY | N | 0.3% below its $779.09 high on narrow leadership; HYG at -4.4% YTD does not confirm. |
| QQQ | N | +22.6% YTD on net-cash mega-caps; shielded from refinancing but already priced for it. |
| IWM | UW | -1.2% WoW and 8.9% below its $305.09 high; small caps bear the refinancing cost of a 5.28% 10Y. |
| BTC | N | -4.3% WoW with 57% dominance; the strongest balance sheet in a deleveraging asset class. |
| GLD | N | $383.93, 22.6% below its $495.90 high; shock-hedge value is offset by a 5.28% 10Y carry cost. |
On-Chain Pulse
The on-chain read this week is selective accumulation inside a broad pullback rather than a rotation back into risk. Nansen's sector data centres buying on Ethereum and a short-dated DeFi rebound, while Solana flows point the other way, and bitcoin, XRP and BNB traded as pure beta to tighter funding. The intel package does not carry Hyperliquid whale positioning, funding rates or open-interest levels for the majors this week, so we report the cohort data available and do not infer the rest.
Bitcoin is the anchor of the class and the major where the intel package is thinnest. BTC fell -4.3% WoW to $82,758 in our market snapshot, the smallest decline among the majors, and sits 4.4% below its $86,599 52-week high. Dominance at 57% of a $2.92T total crypto market capitalisation shows capital consolidating into bitcoin rather than exiting the asset class. The intel block carries no Nansen smart-trader net position, no Hyperliquid whale exposure ratio and no funding or open-interest level for BTC this week, so we do not read derivatives positioning off the price. What the snapshot does show is relative resilience: a -4.3% move against -8.7% for ETH and -9.6% for SOL is the pattern of leverage being cut at the edges of the class first. For positioning, we hold BTC at neutral as the highest-quality balance sheet in a deleveraging asset class, and we would revisit the call if dominance breaks below 57% while BTC fails to recover toward its $86,599 high.
Ethereum is the only major where smart money leaned against the price. Smart-money wallets were net buyers of ETH by +$964.8k over the trailing seven days, while ETH fell -8.7% WoW to $2,488.14 in our market snapshot. The DeFi complex built on Ethereum shows the same late turn: Uniswap saw -$2.2M of smart-money net selling across seven days but +$185.5k of net buying in the latest 24 hours, and Aave moved from -$730.8k over the week to +$811.3k in the last day. Aerodrome on Base is the more persistent signal, at +$677.5k over seven days and +$729.9k over 24 hours. This is a same-cohort reversal over a short window rather than a confirmed trend, and the absence of a whale or funding read means we cannot tell whether derivatives positioning agrees with the spot buying. For positioning, we keep ETH at underweight: a sub-$1M weekly smart-money bid is too small to offset an asset trading with high beta to bitcoin while the 2Y yields 4.77%. We would treat a sustained multi-week extension of DeFi buying, paired with ETH reclaiming its $2,775.05 52-week high, as the signal to move to neutral.
Solana carries the opposite signal. Nansen flags rising exchange deposits and smart-trader selling on Solana this week, and SOL fell -9.6% WoW to $109.82, the steepest decline among the majors in our snapshot and -13.4% YTD. Exchange deposits matter because tokens moved onto venues are inventory available for sale, so the flow points to supply building rather than wallets accumulating into weakness. This is the pattern we expect when leverage unwinds from the edge of the asset class inward, with the highest-beta liquid token absorbing forced selling first. The intel does not quantify the deposit size or a cohort net position, so we read direction only. We hold no section view on SOL. Our positioning implication is that SOL weakness is flow-confirmed rather than a sentiment overshoot, and we would not use it as a source of beta while BTC dominance holds at 57%.
XRP traded as high beta with no cohort signal to offset it. The token fell -8.9% WoW, roughly twice bitcoin's -4.3% decline and close to ETH's -8.7%, which places it firmly in the group that absorbed the heaviest liquidation pressure. The intel block carries no Nansen smart-trader flow, no Hyperliquid whale exposure, no exchange-flow figure and no funding or open-interest level for XRP this week, so we read the move through price and beta alone. A decline of that size alongside a 57% BTC dominance reading is consistent with perpetual funding costs rising as the 2Y holds at 4.77% and the dollar index sits at 121.38. Unlike ETH, there is no smart-money bid in the data showing accumulation into weakness. We hold no section view on XRP; our positioning implication is to treat it as beta to bitcoin rather than an independent thesis, and to require a measurable cohort-flow signal before adding any exposure.
BNB held up better than the other altcoins but still fell well beyond bitcoin. BNB lost -7.0% WoW, less than ETH at -8.7% and SOL at -9.6% but a clear step beyond BTC at -4.3%, so it sat in the middle of the beta ladder this week. The intel package carries no Nansen smart-trader position, no Hyperliquid whale ratio, no spot-versus-perps divergence and no funding or open-interest level for BNB, so we do not attribute the relative resilience to positioning we cannot see. The ordering of losses across the five majors matches the order we would expect from leverage unwinding under a rising cost of money, and BNB's place in that order is a beta reading, not an accumulation reading. We hold no section view on BNB. Our positioning implication is that BNB offers no flow-confirmed reason to rotate out of bitcoin while dominance holds at 57%, and we would need cohort buying data before treating its smaller drawdown as a signal.
What We're Watching
Three thresholds govern the draft. First, a 10Y close above its 5.31% 52-week high moves the 10Y to underweight and pushes SPY from neutral to underweight, because term premium would then be overpowering even the net-cash mega-cap cohort. Second, HYG breaking its $76.90 low in the same week TLT breaks $77.11 would mark a shift from a rates repricing to a funding event, and we would add to the 2Y overweight. Third, a 2Y retake of its 4.92% high with the 10Y at 5.28% compresses the curve to 36bp and inverts our steepener. On the upside, SPY through $779.09 with IWM outperforming, alongside EUR/USD holding above 1.1232, would signal a disinflationary boom and argue for adding equity beta.
This Week in Charts